
spine_placement_demo
Spine的放置演示
调整轴Spine的位置和外观。
1 | import numpy as np |
1 | fig = plt.figure() |

定义一个调整轴Spine位置的方法
1 | def adjust_spines(ax, spines): |
使用我们的新adjust_spines方法创建另一个图形。
1 | fig = plt.figure() |

下载这个示例
本博客所有文章除特别声明外,均采用 CC BY-NC-SA 4.0 许可协议。转载请注明来源 Estom的博客!
相关推荐

2021-12-24
ssh-agent
ssh-agentssh密钥管理器 补充说明ssh-agent命令 是一种控制用来保存公钥身份验证所使用的私钥的程序。ssh-agent在X会话或登录会话之初启动,所有其他窗口或程序则以客户端程序的身份启动并加入到ssh-agent程序中。通过使用环境变量,可定位代理并在登录到其他使用ssh机器上时使用代理自动进行身份验证。 其实ssh-agent就是一个密钥管理器,运行ssh-agent以后,使用ssh-add将私钥交给ssh-agent保管,其他程序需要身份验证的时候可以将验证申请交给ssh-agent来完成整个认证过程。 语法12ssh-agent [-c | -s] [-d] [-a bind_address] [-t life] [command [arg ...]]ssh-agent [-c | -s] -k 选项123456-a bind_address:bind the agent to the UNIX-domain socket bind_address.-c:生成C-shell风格的命令输出。-d:调试模式。-k:把ssh-agent进程杀掉。-s:生成B...
2022-12-05
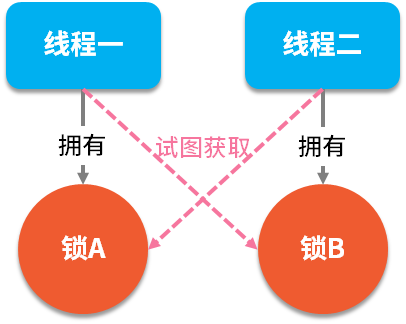
06.谈谈你对锁的理解?如何手动模拟一个死锁?
谈谈你对锁的理解?如何手动模拟一个死锁?在并发编程中有两个重要的概念:线程和锁,多线程是一把双刃剑,它在提高程序性能的同时,也带来了编码的复杂性,对开发者的要求也提高了一个档次。而锁的出现就是为了保障多线程在同时操作一组资源时的数据一致性,当我们给资源加上锁之后,只有拥有此锁的线程才能操作此资源,而其他线程只能排队等待使用此锁。当然,在所有的面试中也都少不了关于“锁”方面的相关问题。 典型回答死锁是指两个线程同时占用两个资源,又在彼此等待对方释放锁资源,如下图所示: 死锁的代码演示如下: 12345678910111213141516171819202122232425262728293031323334353637383940414243import java.util.concurrent.TimeUnit;public class LockExample { public static void main(String[] args) { deadLock(); // 死锁 }/** * 死锁 */private s...

2021-12-24
vgdisplay
vgdisplay显示LVM卷组的信息 补充说明vgdisplay命令 用于显示LVM卷组的信息。如果不指定”卷组”参数,则分别显示所有卷组的属性。 语法1vgdisplay(选项)(参数) 选项12-A:仅显示活动卷组的属性;-s:使用短格式输出的信息。 参数卷组:要显示属性的卷组名称。 实例使用vgdisplay命令显示存在的卷组”vg1000”的属性。在命令行中输入下面的命令: 1[root@localhost ~]# vgdisplay vg1000 #显示卷组"vg1000"的属性 输出信息如下: 12345 --- Volume group --- VG Name vg1000 ......省略部分输出内容...... free PE / Size 50 / 200.00 MB VG UUID ICprwg-ZmhA-JKYF-WYuy-jNHa-AyCN-ZS5F7B
2022-12-04
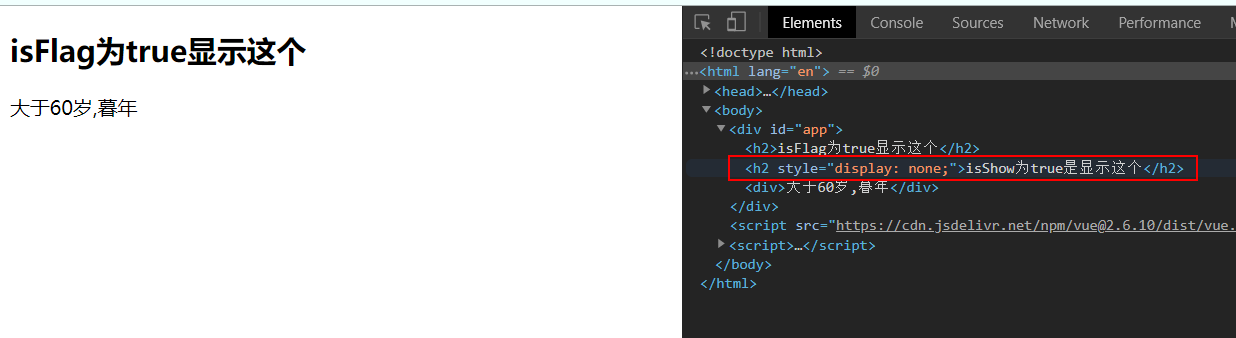
07-条件判断
1. v-if、v-else、v-elseifv-if用于条件判断,判断Dom元素是否显示。 1234567891011121314151617181920212223242526272829<!DOCTYPE html><html lang="en"><head> <meta charset="UTF-8"> <meta name="viewport" content="width=device-width, initial-scale=1.0"> <meta http-equiv="X-UA-Compatible" content="ie=edge"> <title>Document</title></head><body> <div id="app"> <h2 v-if="i...

2022-12-04
12.redis应用示例
- [1. 统计活跃用户](#1-统计活跃用户) - [2. 搭建高可用redis集群](#2-搭建高可用redis集群) - [1. 常见redis集群](#1-常见redis集群) - [2. 单机版redis集群](#2-单机版redis集群) - [2.1 修改redis配置文件](#21-修改redis配置文件) - [2.2 重新打包redis镜像](#22-重新打包redis镜像) - [2.3 编辑docker-compose.yml文件](#23-编辑docker-composeyml文件) - [2.4 创建redis集群](#24-创建redis集群) - [2.5 创建带有密码的redis集群](#25-创建带有密码的redis集群) - [2.6 创建集群中遇到的问题](#26-创建集群中遇到的问题) # 1. 统计活跃用户 场景: 1亿个用户,用户登陆,标记为今天活跃,否则记为不活跃,记录最活跃用户。 12345678910111213141516171819202122232425262...

2021-09-07
basics_of_libuv
Basics of libuvlibuv强制使用异步和事件驱动的编程风格。它的核心工作是提供一个event-loop,还有基于I/O和其它事件通知的回调函数。libuv还提供了一些核心工具,例如定时器,非阻塞的网络支持,异步文件系统访问,子进程等。 Event loops在事件驱动编程中,程序会关注每一个事件,并且对每一个事件的发生做出反应。libuv会负责将来自操作系统的事件收集起来,或者监视其他来源的事件。这样,用户就可以注册回调函数,回调函数会在事件发生的时候被调用。event-loop会一直保持运行状态。用伪代码描述如下: 1234while there are still events to process: e = get the next event if there is a callback associated with e: call the callback 举几个事件的例子: 准备好被写入的文件。 包含准备被读取的数据的socket。 超时的定时器。 event-loop最终会被uv_ru...


