
tick_labels_from_values
从值列表中设置刻度标签
使用ax.set_xticks会导致在当前选择的刻度上设置刻度标签。 但是,您可能希望允许matplotlib动态选择刻度数及其间距。
在这种情况下,最好从刻度线上的值确定刻度标签。 以下示例显示了如何执行此操作。
注意:这里使用MaxNLocator来确保刻度值取整数值。

1 | import matplotlib.pyplot as plt |
下载这个示例
本博客所有文章除特别声明外,均采用 CC BY-NC-SA 4.0 许可协议。转载请注明来源 Estom的博客!
相关推荐

2021-12-24
setpci
setpci查询和配置PCI设备的使用工具 补充说明setpci命令 是一个查询和配置PCI设备的使用工具。 语法1setpci(选项)(参数) 选项12345-v:显示指令执行的细节信息;-f:当没有任何操作需要完成时,不显示任何信息;-D:测试模式,并不真正将配置信息写入寄存器;-d:仅显示给定厂商和设备的信息;-s:仅显示指定总线、插槽上的设备或设备上的功能块信息。 参数 PCI设备:指定要配置的PCI设备; 操作:指定要完成的配置操作。 实例Linux下调节笔记本屏幕亮度方法: 首先进入终端输入lspci命令,列出各种设备的地址: 12345678lspci00:00.0 host bridge: Intel Corporation Mobile 945GM/PM/GMS, 943/940GML and 945GT Express Memory Controller Hub (rev 03)00:02.0 VGA compatible controller: Intel Corporation Mobile 945GM/GMS, 943/940GML Express...

2021-03-19
8.2 十进制数字1的个数
1 1~n 整数中 1 出现的次数问题描述 输入一个整数 n ,求1~n这n个整数的十进制表示中1出现的次数。例如,输入12,1~12这些整数中包含1 的数字有1、10、11和12,1一共出现了5次。 链接 问题分析问题分类 数值问题 策略选择算法设计算法分析 时间复杂度 O(logn) : 循环内的计算操作使用 O(1)时间;循环次数为数字 n 的位数,即logn ,因此循环使用O(logn)时间。 空间复杂度 O(1)O(1) : 几个变量使用常数大小的额外空间。 算法实现1234567891011121314151617181920int countDigitOne(int n) { int i=0; int wei=0; int result=0; int end=0; while(n!=0){ wei=n%10; i++; if(wei>1){ result+=(i-1)*wei*pow(10,i-2)+pow(10,i-1); ...
2021-03-20
17
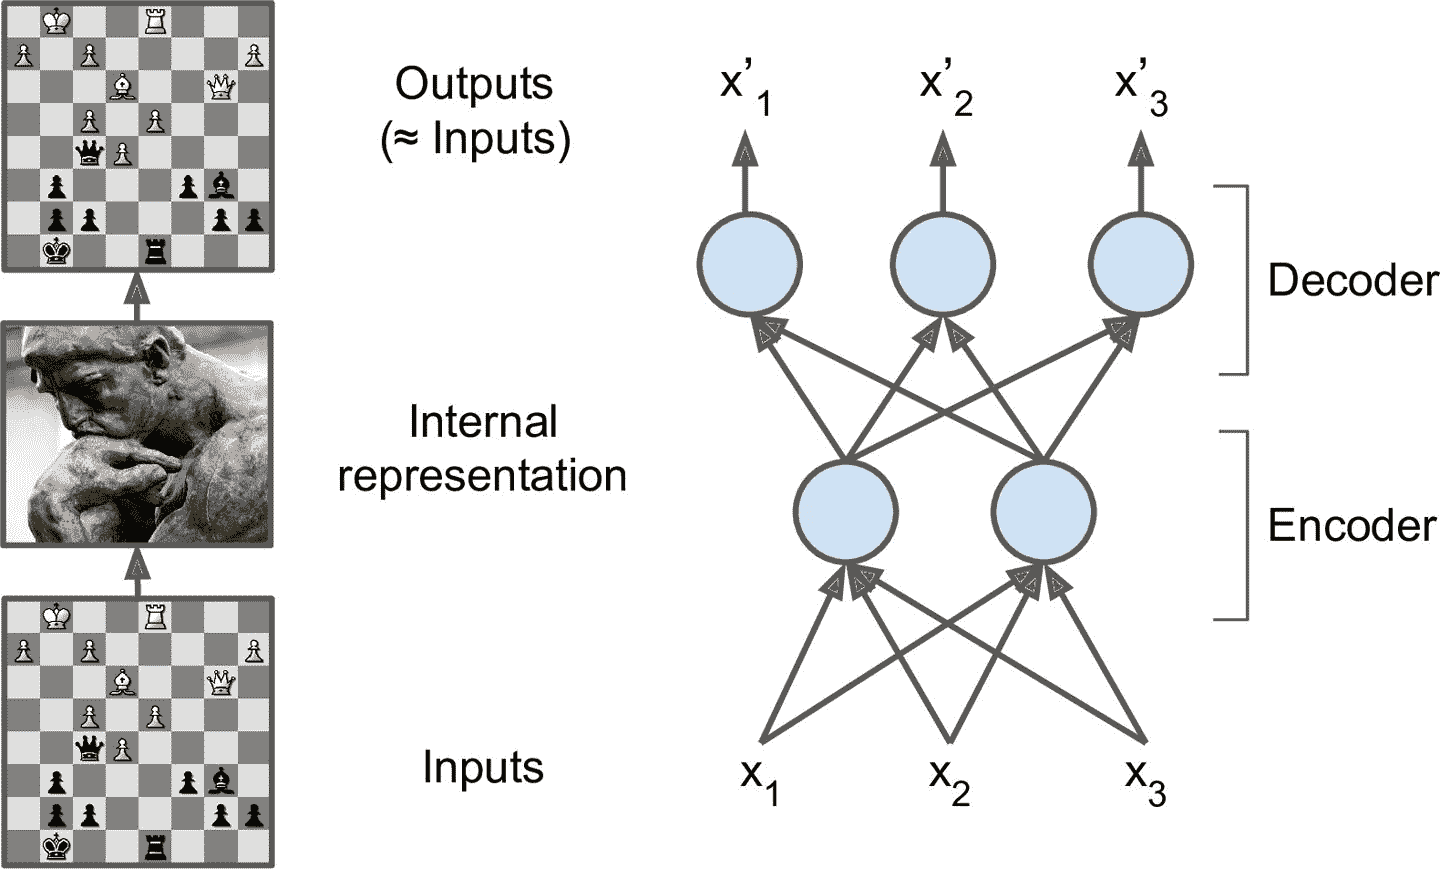
十七、使用自编码器和 GAN 做表征学习和生成式学习 译者:@SeanCheney 自编码器是能够在无监督(即,训练集是未标记)的情况下学习输入数据的紧密表征(叫做潜在表征或编码)的人工神经网络。这些编码通常具有比输入数据低得多的维度,使得自编码器对降维有用(参见第 8 章)。自编码器还可以作为强大的特征检测器,它们可以用于无监督的深度神经网络预训练(正如我们在第 11 章中讨论过的)。最后,一些自编码器是生成式模型:他们能够随机生成与训练数据非常相似的新数据。例如,您可以在脸图片上训练自编码器,然后可以生成新脸。但是生成出来的图片通常是模糊且不够真实。 相反,用对抗生成网络(GAN)生成的人脸可以非常逼真,甚至让人认为他们是真实存在的人。你可以去这个网址,这是用 StyleGAN 生成的人脸,自己判断一下(还可以去这里,看看 GAN 生成的卧室图片),GAN 现在广泛用于超清图片涂色,图片编辑,将草图变为照片,增强数据集,生成其它类型的数据(比如文本、音频、时间序列),找出其它模型的缺点并强化,等等。 自编码器和 GAN 都是无监督的,都可以学习紧密表征,都可以用作生成模型,...

2021-03-08
TensorFlow-code architecture
http://www.360doc.com/content/17/0220/19/39202731_630623149.shtml TF系统依赖TF托管在github平台,有google groups和contributors共同维护。 TF提供了丰富的深度学习相关的API,支持Python和C/C++接口。 TF提供了可视化分析工具Tensorboard,方便分析和调整模型。 TF支持Linux平台,Windows平台,Mac平台,甚至手机移动设备等各种平台 TF的系统架构第一层设备通信层负责网络通信和设备管理。设备管理可以实现TF设备异构的特性,支持CPU、GPU、Mobile等不同设备。网络通信依赖gRPC通信协议实现不同设备间的数据传输和更新。 第二层是Tensor的OpKernels实现。这些OpKernels以Tensor为处理对象,依赖网络通信和设备内存分配,实现了各种Tensor操作或计算。Opkernels不仅包含MatMul等计算操作,还包含Queue等非计算操作,这些将在第5章Kernels模块详细介绍。 第三层是图计算层(Graph),包含本地计...
2021-12-24
ip6tables
ip6tableslinux中防火墙软件 补充说明ip6tables命令 和iptables一样,都是linux中防火墙软件,不同的是ip6tables采用的TCP/ip协议为IPv6。 语法1ip6tables(选项) 选项1234567891011121314151617-t<表>:指定要操纵的表;-A:向规则链中添加条目;-D:从规则链中删除条目;-i:向规则链中插入条目;-R:替换规则链中的条目;-L:显示规则链中已有的条目;-F:清楚规则链中已有的条目;-Z:清空规则链中的数据包计算器和字节计数器;-N:创建新的用户自定义规则链;-P:定义规则链中的默认目标;-h:显示帮助信息;-p:指定要匹配的数据包协议类型;-s:指定要匹配的数据包源ip地址;-j<目标>:指定要跳转的目标;-i<网络接口>:指定数据包进入本机的网络接口;-o<网络接口>:指定数据包要离开本机所使用的网络接口。-c<计数器>:在执行插入操作(insert),追加操作(append),替换操作(replace)时初始化包计数器和字...

2021-12-24
tr
tr将字符进行替换压缩和删除 补充说明tr命令 可以对来自标准输入的字符进行替换、压缩和删除。它可以将一组字符变成另一组字符,经常用来编写优美的单行命令,作用很强大。 语法1tr(选项)(参数) 选项1234-c或——complerment:取代所有不属于第一字符集的字符;-d或——delete:删除所有属于第一字符集的字符;-s或--squeeze-repeats:把连续重复的字符以单独一个字符表示;-t或--truncate-set1:先删除第一字符集较第二字符集多出的字符。 参数 字符集1:指定要转换或删除的原字符集。当执行转换操作时,必须使用参数“字符集2”指定转换的目标字符集。但执行删除操作时,不需要参数“字符集2”; 字符集2:指定要转换成的目标字符集。 实例将输入字符由大写转换为小写: 12echo "HELLO WORLD" | tr 'A-Z' 'a-z'hello world ‘A-Z’ 和 ‘a-z’都是集合,集合是可以自己制定的,例如:’ABD-}’、’bB.,’、’a-de-h’、’a-...


