
annotate_with_units
带有单位的注释
该示例说明了如何使用厘米级绘图创建文本和箭头注释。
此示例需要 basic_units.py

1 | import matplotlib.pyplot as plt |
下载这个示例
本博客所有文章除特别声明外,均采用 CC BY-NC-SA 4.0 许可协议。转载请注明来源 Estom的博客!
相关推荐
2021-03-09
传输层学习之二(TCP基本概念)
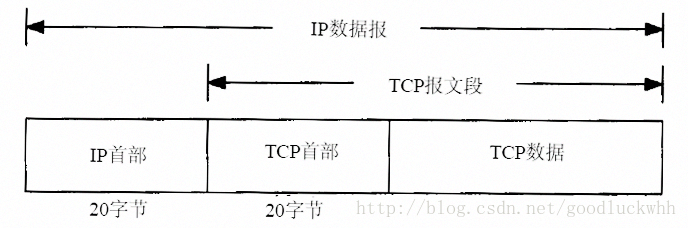
TCP是一种极为重要的传输层服务(要不也不会称为TCP/IP协议族了:)),它提供了与UDP完全不同的服务。TCP提供的是一种面向连接的、可靠的字节流服务。 面向连接:使用TCP的两端在彼此交换数据之前必须先建立一个TCP连接。TCP连接是点对点的,在一个TCP连接中,仅有两方可以彼此通信,TCP不使用广播和多播。TCP的连接和电话网络的连接不同,它对中间的转发设备即路由器、交换机是透明的,连接的信息只存在于连接的两个端系统之上。 可靠:TCP保证数据传输的可靠性,TCP通过下列方式来提供可靠性: 字节流:两个应用程序通过TCP连接交换8bit字节构成的字节流。TCP不在字节流中插入记录标识符。字节流服务中,接收方无法了解发方每次发送了多少字节,可以确保的是一端将字节流放到TCP连接上,同样的字节流将出现在TCP连接的另一端。另外,TCP对字节流的内容不作任何解释。TCP不知道传输的数据字节流是二进制数据,还是ASCII字符、EBCDIC字符或者其他类型数据。对字节流的解释由TCP连接双方的应用层解释。 和UDP相同,TCP提供的是全双工的服务。 一、TCP首...

2021-12-24
which
which查找并显示给定命令的绝对路径 补充说明which命令 用于查找并显示给定命令的绝对路径,环境变量PATH中保存了查找命令时需要遍历的目录。which指令会在环境变量$PATH设置的目录里查找符合条件的文件。也就是说,使用which命令,就可以看到某个系统命令是否存在,以及执行的到底是哪一个位置的命令。 语法1which(选项)(参数) 选项1234-n<文件名长度>:制定文件名长度,指定的长度必须大于或等于所有文件中最长的文件名;-p<文件名长度>:与-n参数相同,但此处的<文件名长度>包含了文件的路径;-w:指定输出时栏位的宽度;-V:显示版本信息。 参数指令名:指令名列表。 实例查找文件、显示命令路径: 12345[root@localhost ~]# which pwd/bin/pwd[root@localhost ~]# which adduser/usr/sbin/adduser 说明:which是根据使用者所配置的 PATH 变量内的目录去搜寻可运行档的!所以,不同的 PATH 配置内容所找到的命令当然不一样的! 用...
2021-04-10
1.2 开放封闭原则
1 开放封闭原则 OCP(Open Closed Principle) 为什么 “所有系统在其生命周期中都会进行变化,只要系统要开发一个版本以上这一点就需时刻记住。” All systems change during their life cycles. This must be borne in mind when developing systems expected to last longer than the first version. 在面向对象的设计中有很多流行的思想,比如说 “所有的成员变量都应该设置为私有(Private)” “要避免使用全局变量(Global Variables)” “使用运行时类型识别(RTTI:Run Time Type Identification,例如dynamic_cast)是危险的” 那么,这些思想的源泉是什么?为什么它们要这样定义?这些思想总是正确的吗?本篇文章将介绍这些思想的基础:开放封闭原则(Open Closed Principle)。 那么我们到底如何才能构建一个稳定的设计来面对这些变化,以使软件生命周期持...
2024-05-13
03 Istio注入原理
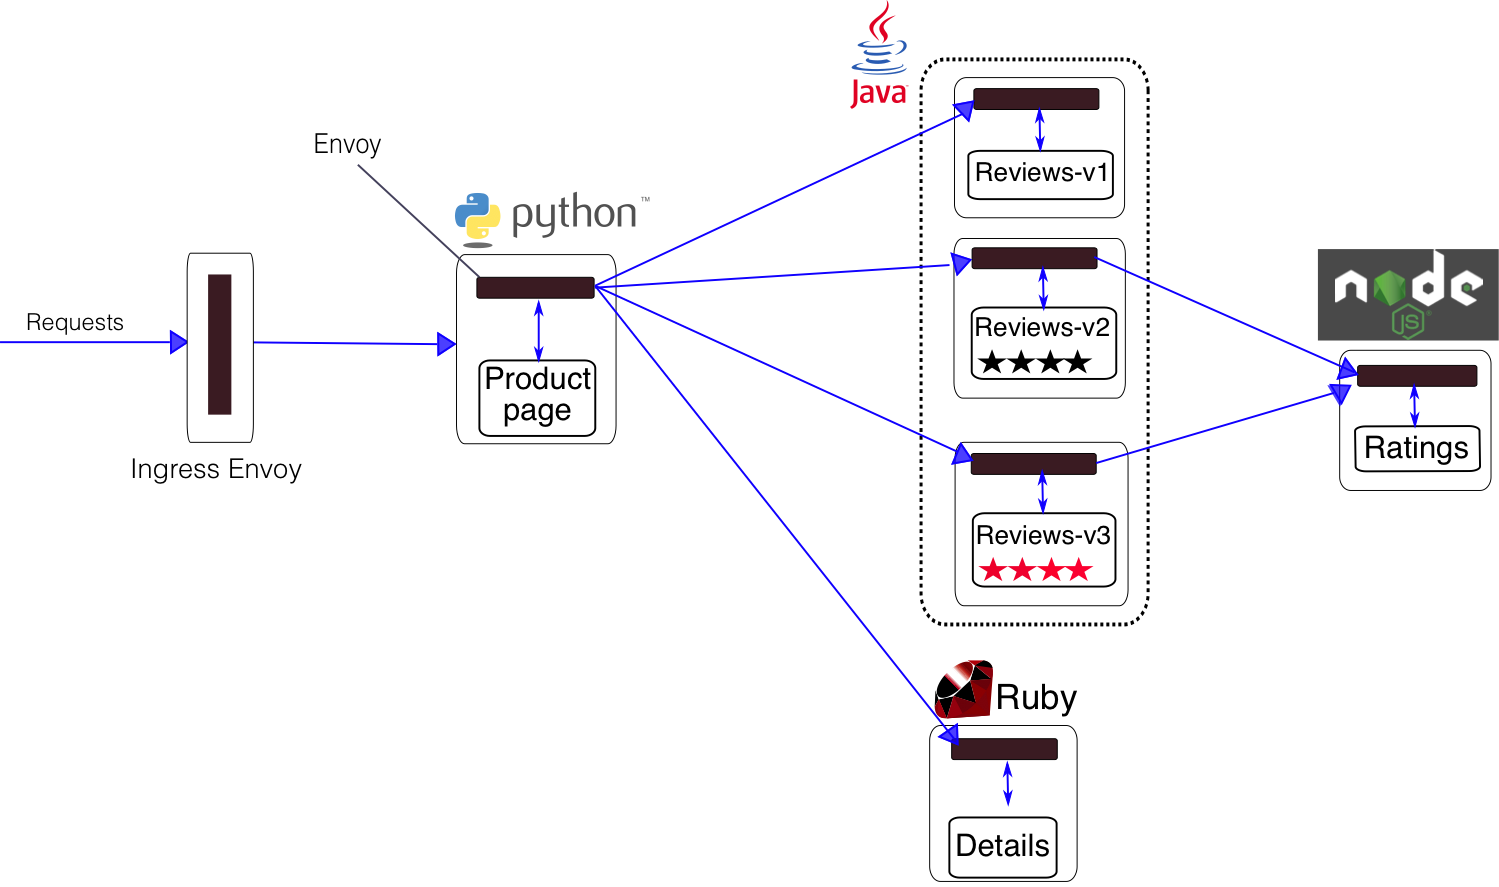
规范Pod Spec 中需满足的条件为了成为 服务网格中的一部分,Kubernetes 集群中的每个 Pod 都必须满足如下条件,这些规范不是由 Istio 自动注入的,而需要 生成 Kubernetes 应用部署的 YAML 文件时需要遵守的: Service 关联:每个 pod 都必须只属于某一个 Kubernetes Service (当前不支持一个 pod 同时属于多个 service)。命名的端口:Service 的端口必须命名。端口的名字必须遵循如下格式 <protocol>[-<suffix>],可以是 http、http2、 grpc、 mongo、 或者 redis 作为 <protocol> ,这样才能使用 Istio 的路由功能。例如 name: http2-foo 和 name: http 都是有效的端口名称,而 name: http2foo 不是。如果端口的名称是不可识别的前缀或者未命名,那么该端口上的流量就会作为普通的 TCP 流量来处理(除非使用 Protocol: UDP 明确声明使用 UDP 端口)。带有 ap...

2021-03-20
3
三、分类 译者:@时间魔术师 校对者:@Lisanaaa、@飞龙、@ZTFrom1994、@XinQiu、@tabeworks、@JasonLee、@howie.hu 在第一章我们提到过最常用的监督学习任务是回归(用于预测某个值)和分类(预测某个类别)。在第二章我们探索了一个回归任务:预测房价。我们使用了多种算法,诸如线性回归,决策树,和随机森林(这个将会在后面的章节更详细地讨论)。现在我们将我们的注意力转到分类任务上。 MNIST在本章当中,我们将会使用 MNIST 这个数据集,它有着 70000 张规格较小的手写数字图片,由美国的高中生和美国人口调查局的职员手写而成。这相当于机器学习当中的“Hello World”,人们无论什么时候提出一个新的分类算法,都想知道该算法在这个数据集上的表现如何。机器学习的初学者迟早也会处理 MNIST 这个数据集。 Scikit-Learn 提供了许多辅助函数,以便于下载流行的数据集。MNIST 是其中一个。下面的代码获取 MNIST 12345678910111213>>> from sklearn.datasets im...
2023-08-13
16 explain性能分析
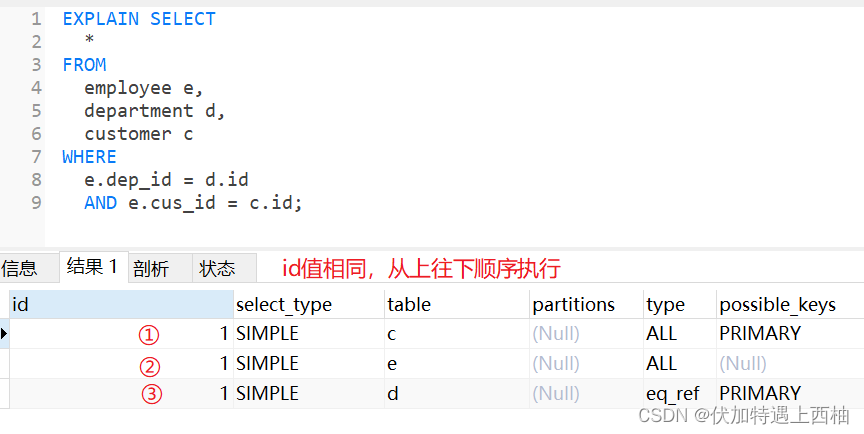
1 简介在MySQL中,EXPLAIN命令的返回值是一个表格,包含了查询语句的执行计划。表格中的每一行代表了一个访问方式,每一列代表了一个属性,例如: 12345+----+-------------+-------+-------+---------------+---------+---------+------+------+-------------+| id | select_type | table | type | possible_keys | key | key_len | ref | rows | Extra |+----+-------------+-------+-------+---------------+---------+---------+------+------+-------------+| 1 | SIMPLE | users | const | PRIMARY | PRIMARY | 4 | const| 1 | |+----+----------...


