
bar_unit_demo
与单位组合的条形图
此示例与以厘米为单位的条形图演示相同。
此示例需要 basic_units.py

1 | import numpy as np |
下载这个示例
本博客所有文章除特别声明外,均采用 CC BY-NC-SA 4.0 许可协议。转载请注明来源 Estom的博客!
相关推荐

2021-12-24
mkisofs
mkisofs建立ISO 9660映像文件 补充说明mkisofs命令 用来将指定的目录与文件做成ISO 9660格式的映像文件,以供刻录光盘。 语法1mkisofs(选项)(参数) 选项1234567891011121314151617181920212223242526272829303132333435-a或--all:mkisofs通常不处理备份文件。使用此参数可以把备份文件加到映像文件中;-A<应用程序id>或-appid<应用程序ID>:指定光盘的应用程序ID;-abstract<摘要文件>:指定摘要文件的文件名;-b<开机映像文件>或-eltorito-boot<开机映像文件>:指定在制作可开机光盘时所需的开机映像文件;-biblio<ISBN文件>:指定ISBN文件的文件名,ISBN文件位于光盘根目录下,记录光盘的ISBN;-c<开机文件名称>:制作可开机光盘时,mkisofs会将开机映像文件中的全-eltorito-catalog<开机文件名称>全部内容作成一个文件...
2024-05-13
02 Sidecar
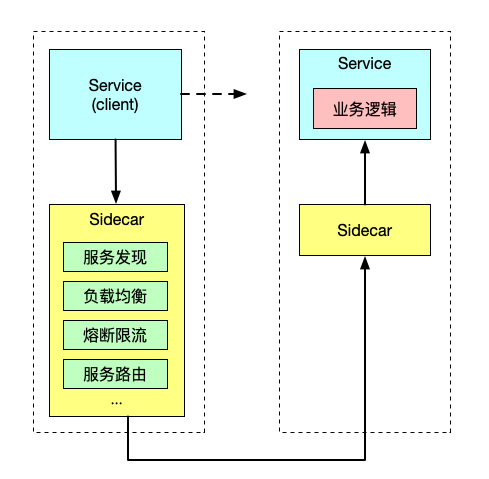
简介Sidecar模式将应用程序的功能划分为单独的进程运行在同一个最小调度单元中(例如 Kubernetes 中的 Pod)可以被视为 sidecar 模式。如下图所示,sidecar 模式允许您在应用程序旁边添加更多功能,而无需额外第三方组件配置或修改应用程序代码。 就像连接了 Sidecar 的三轮摩托车一样,在软件架构中, Sidecar 连接到父应用并且为其添加扩展或者增强功能。Sidecar 应用与主应用程序松散耦合。它可以屏蔽不同编程语言的差异,统一实现微服务的可观察性、监控、日志记录、配置、断路器等功能。 使用 Sidecar 模式的优势使用 sidecar 模式部署服务网格时,无需在节点上运行代理,但是集群中将运行多个相同的 sidecar 副本。在 sidecar 部署方式中,每个应用的容器旁都会部署一个伴生容器,这个容器称之为 sidecar 容器。Sidecar 接管进出应用容器的所有流量。在 Kubernetes 的 Pod 中,在原有的应用容器旁边注入一个 Sidecar 容器,两个容器共享存储、网络等资源,可以广义的将这个包含了 sidecar 容器...

2021-09-06
Select socket
过程分析 用户进程创建socket对象,拷贝监听的fd到内核空间,每一个fd会对应一张系统文件表,内核空间的fd响应到数据后,就会发送信号给用户进程数据已到; 用户进程再发送系统调用,比如(accept)将内核空间的数据copy到用户空间,同时作为接受数据端内核空间的数据清除,这样重新监听时fd再有新的数据又可以响应到了(发送端因为基于TCP协议所以需要收到应答后才会清除) 优点 相比其他模型,使用select() 的事件驱动模型只用单线程(进程)执行,占用资源少,不消耗太多 CPU,同时能够为多客户端提供服务。如果试图建立一个简单的事件驱动的服务器程序,这个模型有一定的参考价值。 缺点 首先select()接口并不是实现“事件驱动”的最好选择。因为当需要探测的句柄值较大时,select()接口本身需要消耗大量时间去轮询各个句柄。 很多操作系统提供了更为高效的接口,如linux提供了epoll,BSD提供了kqueue,Solaris提供了/dev/poll,…。 如果需要实现更高效的服务器程序,类似epoll这样的接口更被推荐。遗憾的是不同的操作系统特供...

2020-09-26
rotate_axes3d_sgskip
旋转3D绘图一个非常简单的旋转3D绘图动画。 有关动画3D绘图的另一个简单示例,请参阅wire3d_animation_demo。 (构建文档库时会跳过此示例,因为它有意运行需要很长时间) 123456789101112131415from mpl_toolkits.mplot3d import axes3dimport matplotlib.pyplot as pltfig = plt.figure()ax = fig.add_subplot(111, projection='3d')# load some test data for demonstration and plot a wireframeX, Y, Z = axes3d.get_test_data(0.1)ax.plot_wireframe(X, Y, Z, rstride=5, cstride=5)# rotate the axes and updatefor angle in range(0, 360): ax.view_init(30, angle) plt.draw() ...

2020-10-13
24_Transfer Learning
Transfer Learning 迁移学习,主要介绍共享layer的方法以及属性降维对比的方法 Introduction迁移学习,transfer learning,旨在利用一些不直接相关的数据对完成目标任务做出贡献 not directly related以猫狗识别为例,解释“不直接相关”的含义: input domain是类似的,但task是无关的 比如输入都是动物的图像,但这些data是属于另一组有关大象和老虎识别的task input domain是不同的,但task是一样的 比如task同样是做猫狗识别,但输入的是卡通类型的图像 compare with real life事实上,我们在日常生活中经常会使用迁移学习,比如我们会把漫画家的生活自动迁移类比到研究生的生活 overview迁移学习是很多方法的集合,这里介绍一些概念: Target Data:和task直接相关的data Source Data:和task没有直接关系的data 按照labeled data和unlabeled data又可以划分为四种: Case 1这里ta...
2024-05-28
入门教程
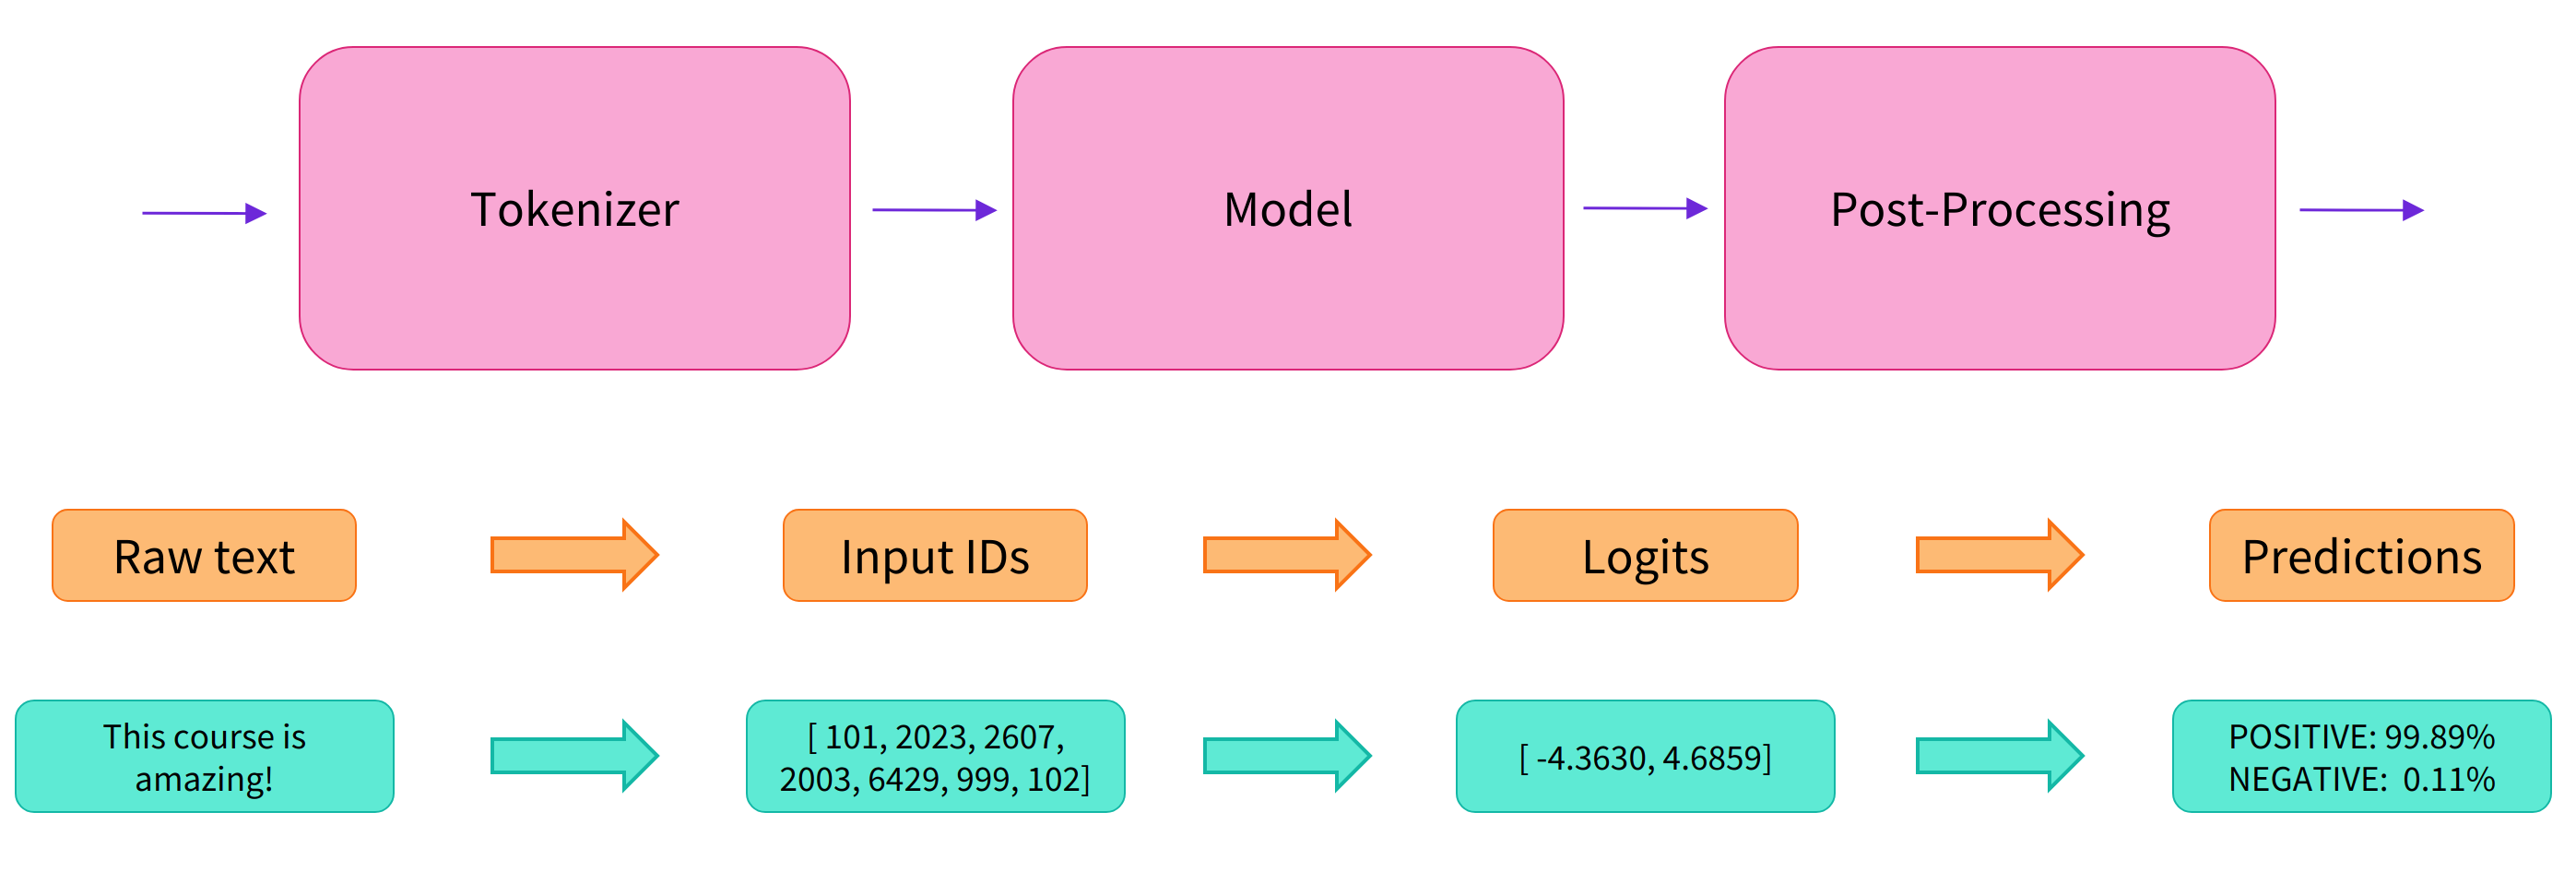
transofrmers最简单的说明 参考文档https://transformers.run/c2/2021-12-08-transformers-note-1/https://fancyerii.github.io/2021/05/11/huggingface-transformers-1/#%E7%AE%80%E4%BB%8B官方文档https://huggingface.co/docs/transformers/v4.36.1/zh/index 是什么目前各种Pretraining的Transformer模型层出不穷,虽然这些模型都有开源代码,但是它们的实现各不相同,我们在对比不同模型时也会很麻烦。Huggingface Transformer能够帮我们跟踪流行的新模型,并且提供统一的代码风格来使用BERT、XLNet和GPT等等各种不同的模型。 基本原则huggingface的transfomers工具库,只有configuration,models和tokenizer三个主要类。所有的模型都可以通过统一的from_pretrained()函数来实现加载,transf...


