
connect_simple01
连接简单例子01

1 | from matplotlib.patches import ConnectionPatch |
下载这个示例
本博客所有文章除特别声明外,均采用 CC BY-NC-SA 4.0 许可协议。转载请注明来源 Estom的博客!
相关推荐

2021-12-24
cu
cu用于连接另一个系统主机 补充说明cu命令 用于连接另一个系统主机。cu(call up)指令可连接另一台主机,并采用类似拨号终端机的接口工作,也可执行简易的文件传输作业。 语法12cu [dehnotv][-a<通信端口>][-c<电话号码>][-E<脱离字符>][-I<设置文件>][-l<外围设备代号>][-s<连线速率>][-x<排错模式>][-z<系统主机>][--help][-nostop][--parity=none][<系统主机>/<电话号码>] 选项123456789101112131415161718-a<通信端口>或-p<通信端口>或--port<通信端口> 使用指定的通信端口进行连线。-c<电话号码>或--phone<电话号码> 拨打该电话号码。-d 进入排错模式。-e或--parity=even 使用双同位检查。-E<脱离字符>或--escape<脱离字符&...
2019-10-15
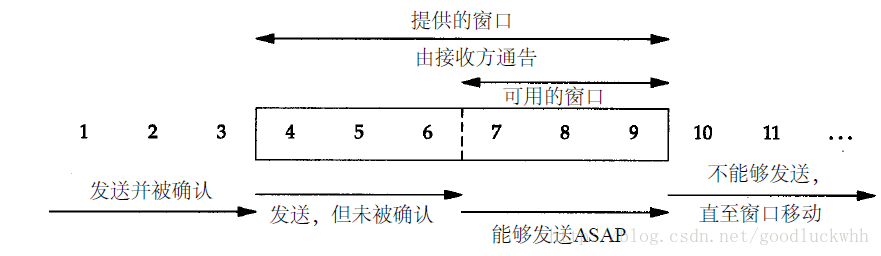
3.5 传输层-TCP可靠数据传输
TCP数据传输1 概述主要内容tcp数据传输主要包括以下几个方面 可靠数据传输(保证数据传输的正确性) 面向连接 序号机制(保证数据顺序) 校验和(防止数据出错) 确认机制(应对丢包) 超时重传(应对丢包、丢失确认) 累计确认(发送方动作,发送方认为之前全被正确接收) 选择重传(接受方动作,接收方维持滑动串口,只要求重传丢失的分组) 流量控制(提高传输效率的流水线方法,考虑接收端的接受能力,发送方的发送速率不应该超过接收端的接受能力) 滑动窗口(对应缓冲区大小,双向缓冲窗口流水线技术) 拥塞控制(通过流量控制实现,考虑断点之间的网络情况,目的使负载不超过网络的传输能力。) 慢启动 拥塞避免 快重传 快恢复 在接收方实现了流量控制 在发送方实现了拥塞控制 TCP主要任务当TCP连接建立之后,应用程序即可使用该连接进行数据收发。应用程序将数据提交给TCP,TCP将数据放入自己的缓存,并且在其认为合适的时候将数据发送出去。在TCP中,数据会被当做字节流并按照MSS的大小进行分段,然后加上TCP头部并提交给网络层。之后数据就会被网络层提交给目地主机,目地主机的IP...

2021-12-24
iperf
iperf网络性能测试工具 补充说明iperf命令 是一个网络性能测试工具。iperf可以测试TCP和UDP带宽质量。iperf可以测量最大TCP带宽,具有多种参数和UDP特性。iperf可以报告带宽,延迟抖动和数据包丢失。利用iperf这一特性,可以用来测试一些网络设备如路由器,防火墙,交换机等的性能。 iperf分为两种版本,Unix/Linux版和Windows版,Unix/Linux版更新比较快,版本最新。Windows版更新慢。Windows版的iperf叫jperf,或者xjperf。jperf是在iperf基础上开发了更好的UI和新的功能。 Linux版本下载地址:http://code.google.com/p/iperf/downloads/list 安装iperf对于windows版的iperf,直接将解压出来的iperf.exe和cygwin1.dll复制到%systemroot%目录即可,对于linux版的iperf,请使用如下命令安装: 12345gunzip -c iperf-<version>.tar.gz | tar...

2022-02-23
2 图生成器
# 图形生成器和图形操作 ## 1 应用经典图形操作 | subgraph \(G ,N启动) | 返回在nbunch中的节点上诱导的子图。 | |---|---| | union (g,h) [, rename, name] ) | 返回图g和h的并集。 | | disjoint_union (g,h) | 返回图G和图H的不相交的并集。 | | cartesian_product (g,h) | 返回g和h的笛卡尔积。 | | compose (g,h) | 返回由h组成的g的新图。 | | complement (g) | 返回g的图补。 | | create_empty_copy (g) [, with_data] ) | 返回图形G的副本,并删除所有边。 | | to_undirected [(图)] | 返回图表的无向视图 graph . | | to_directed [(图)] | 返回图...

2021-03-31
8 连接表查询
系列八 条件语句在各个部分的应用 更新,插入,删除记录的中的数据 条件更新、条件删除 连接查询 12345678910111213141516171819202122232425262728293031323334353637383940414243444546474849505152535455565758596061626364656667686970#第三十六课时--条件更新UPDATE cms_user SET age = age - 3 WHERE username LIKE '____';--更新前三条记录,让已有年龄+10UPDATE cms_user SET age = age +10 LIMIT 3;--按照id降序排列UPDATE cms_user SET age = age +10 ORDER BY id DESC LIMIT 3;--条件删除DELETE FROM cms_user WHERE sex = 'man' ORDER BY age DESC LIMIT 3;#第三十七课时--连接查询--将两个或两个...
2021-03-09
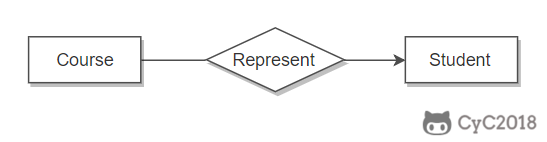
设计篇——2.设计步骤
设计篇——设计步骤1 ER 图定义Entity-Relationship,有三个组成部分:实体、属性、联系。 用来进行关系型数据库系统的概念设计。 实体的三种联系包含一对一,一对多,多对多三种。 如果 A 到 B 是一对多关系,那么画个带箭头的线段指向 B; 如果是一对一,画两个带箭头的线段; 如果是多对多,画两个不带箭头的线段。 下图的 Course 和 Student 是一对多的关系。 表示出现多次的关系一个实体在联系出现几次,就要用几条线连接。 下图表示一个课程的先修关系,先修关系出现两个 Course 实体,第一个是先修课程,后一个是后修课程,因此需要用两条线来表示这种关系。 联系的多向性虽然老师可以开设多门课,并且可以教授多名学生,但是对于特定的学生和课程,只有一个老师教授,这就构成了一个三元联系。 表示子类用一个三角形和两条线来连接类和子类,与子类有关的属性和联系都连到子类上,而与父类和子类都有关的连到父类上。


