
slider_demo
滑块演示
使用滑块小部件来控制绘图的可视属性。
在此示例中,滑块用于选择正弦波的频率。 您可以通过这种方式控制绘图的许多连续变化属性。

1 | import numpy as np |
下载这个示例
本博客所有文章除特别声明外,均采用 CC BY-NC-SA 4.0 许可协议。转载请注明来源 Estom的博客!
相关推荐

2021-09-07
9.3-chinese
9.3 本章总结在本章中,我们了解各种“高级”线程管理技术:线程池和中断线程。也了解了如何使用本地任务队列,使用任务窃取的方式减小同步开销,提高线程池的吞吐量;等待子任务完成的同时执行队列中其他任务,从而来避免死锁。 也了解了使用线程去中断另一个处理线程的各种方式,比如:使用特定的断点和函数执行中断,要不就是使用某种方法,对阻塞等待进行中断。

2021-12-24
egrep
egrep在文件内查找指定的字符串 补充说明egrep命令 用于在文件内查找指定的字符串。egrep执行效果与grep -E相似,使用的语法及参数可参照grep指令,与grep的不同点在于解读字符串的方法。egrep是用extended regular expression语法来解读的,而grep则用basic regular expression 语法解读,extended regular expression比basic regular expression的表达更规范。 语法1egrep(选项)(查找模式)(文件名1,文件名2,……) 实例显示文件中符合条件的字符。例如,查找当前目录下所有文件中包含字符串”Linux”的文件,可以使用如下命令: 1egrep Linux * 结果如下所示: 1234567891011121314# 以下五行为 testfile 中包含Linux字符的行testfile:hello Linux!testfile:Linux is a free Unix-type operating system.testfile:This is a Li...

2021-12-24
rpmsign
rpmsign使用RPM软件包的签名管理工具 补充说明rpmsign命令 使用rpm软件包的签名管理工具。 语法1rpmsign(选项) 选项1234567--addsign:为自动软件包添加签名;--checksig:验证软件包签名;--delsign:删除软件包签名;--import:导入公钥;--resign:重新签名软件包;--nodigest:不验证软件包摘要;--nosignature:不验证软件包签名。

2020-09-26
make_room_for_ylabel_using_axesgrid
使用Axesgrid为Ylabel腾出空间 12345678910111213141516171819202122232425262728293031323334353637383940414243444546474849505152535455565758596061from mpl_toolkits.axes_grid1 import make_axes_locatablefrom mpl_toolkits.axes_grid1.axes_divider import make_axes_area_auto_adjustableif __name__ == "__main__": import matplotlib.pyplot as plt def ex1(): plt.figure(1) ax = plt.axes([0, 0, 1, 1]) #ax = plt.subplot(111) ax.set_yticks([0.5]) ax.set_yticklabels(...

2021-09-07
utilities
Utilities本章介绍的工具和技术对于常见的任务非常的实用。libuv吸收了libev用户手册页中所涵盖的一些模式,并在此基础上对API做了少许的改动。本章还包含了一些无需用完整的一章来介绍的libuv API。 Timers在定时器启动后的特定时间后,定时器会调用回调函数。libuv的定时器还可以设定为,按时间间隔定时启动,而不是只启动一次。可以简单地使用超时时间timeout作为参数初始化一个定时器,还有一个可选参数repeat。定时器能在任何时间被终止。 1234uv_timer_t timer_req;uv_timer_init(loop, &timer_req);uv_timer_start(&timer_req, callback, 5000, 2000); 上述操作会启动一个循环定时器(repeating timer),它会在调用uv_timer_start后,5秒(timeout)启动回调函数,然后每隔2秒(repeat)循环启动回调函数。你可以使用: 1uv_timer_stop(&timer_req); 来停止定时器...
2021-03-09
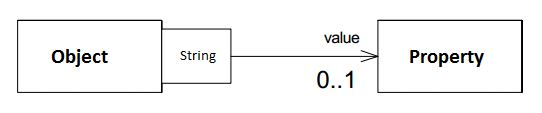
5.1 Dynamic Property(动态属性)
索引 别名 意图 结构 参与者 适用性 效果 实现 实现方式(一):Dynamic Property 的示例实现。 别名 Property Properties Property List 意图 使对象可以为客户提供广泛且可扩展的属性集合。 Lets an object provides a generic and extensible set of properties to clients. 结构 参与者 Object 目标对象可存储 Property 列表。 可使用不同的类型来作为 Property 的标识符,最简单的可以使用 string 类型。 Property 属性定义。 适用性 当以下情况成立时可以使用 Dynamic Property 模式: 当对象需要定义大量属性时。 当对象的属性是运行时可变时。 效果 可在运行时动态的修改对象的属性。 实现 实现方式(一):Dynamic Property 的示例实现。 复制代码 1 namespace DynamicPropertyPattern.Implement...


