
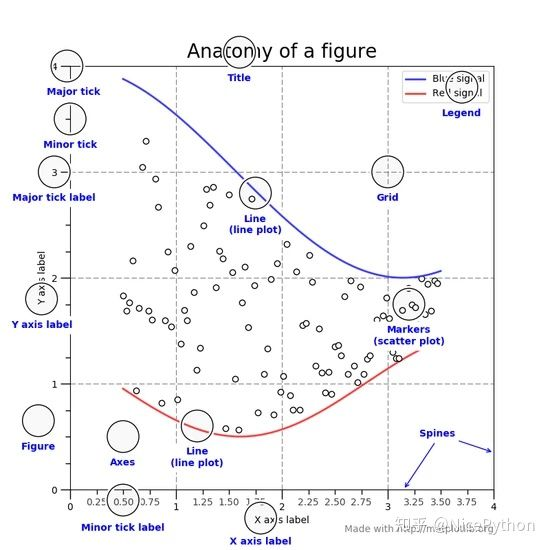
03面向对象绘图方法
面向对象的绘图方式
在这里的实例中,面向对象的方法与命令行的方式进行了混用,不提倡。首先运用好交互式命令行的方式进行绘图。
对象和参数
- axex: 设置坐标轴边界和表面的颜色、坐标刻度值大小和网格的显示
- figure: 控制dpi、边界颜色、图形大小、和子区( subplot)设置
- font: 字体集(font family)、字体大小和样式设置
- grid: 设置网格颜色和线性
- legend: 设置图例和其中的文本的显示
- line: 设置线条(颜色、线型、宽度等)和标记
- patch: 是填充2D空间的图形对象,如多边形和圆。控制线宽、颜色和抗锯齿设置等。
- savefig: 可以对保存的图形进行单独设置。例如,设置渲染的文件的背景为白色。
- verbose: 设置matplotlib在执行期间信息输出,如silent、helpful、debug和debug-annoying。
- xticks和yticks: 为x,y轴的主刻度和次刻度设置颜色、大小、方向,以及标签大小。
绘图步骤
1 | #使用numpy产生数据 |
plot属性
1 | 属性 值类型 |
多图绘制
1 | #一个窗口,多个图,多条数据 |
极坐标
1 | fig = plt.figure(2) |
柱状图
1 | plt.figure(3) |
直方图
1 | fig,(ax0,ax1) = plt.subplots(nrows=2,figsize=(9,6)) |
散点图
1 | fig = plt.figure(4) |
三维图
1 | fig = plt.figure(5) |
集合图形
1 | fig = plt.figure(6) |
本博客所有文章除特别声明外,均采用 CC BY-NC-SA 4.0 许可协议。转载请注明来源 Estom的博客!
相关推荐
2021-03-09
Scrapy框架学习——琐碎知识整理
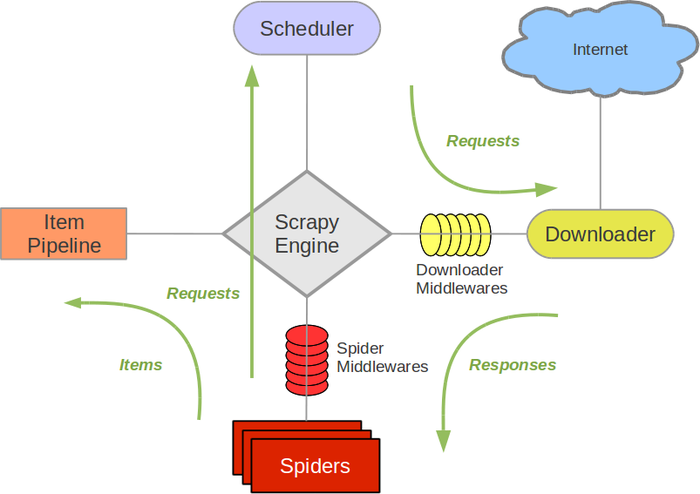
scrapy引擎 调度器 Spiders 下载器 Item Pipeline itemloader用来装载,item用来容纳,itempipeline用来过滤。也负责了指明了存好数据的item的数据流动的方向。itemloader是活动在原始数据和item之间的桥梁。itempipeline是活动在item和具体存储数据的位置之间的桥梁。比如用来操纵数据库、用来写入文件,用来提供下一次爬虫的相关信息。 下载器中间件 由调度器具体指挥,能够根据引擎发送的request对象,封装真正的request请求,并且设置请求的响应参数。不同的下载器中间件,能够完成不同的任务。 Spider中间件 引擎和Spider之间的钩子。用来处理Spider发送给引擎的request和Item和引擎发送给Spider的response。有点像网络的分层,没一层都向发送数据中添加一点内容,每一层都从接受数据中获得一点内容。有很多中间件,可以在这里过滤掉一些错误。另外,如果错误能够越提前的发现,则越有利于提高效率。 扩展Extension和信号signal 框架提供了一个很好的扩展机制。在配置文件中声明,...

2019-09-29
09latex数学公式
latex数学公式数学公式行内公式 $ $ ( ) begin{math} end{math} 行间公式 $$ $$ [ ] begin{displaymath} end{displaymath} 行间公式自动编号\usepackage{asmath} \ref{}begin{equation} \label{}设置标签进行交叉引用end{equation} 不需要的自动编号\begin{equation*}\end{equation*}

2020-09-26
trisurf3d_2
多三角三维曲面使用三角形网格绘制曲面的另外两个示例。 第一个演示使用plot_trisurf的三角形参数,第二个设置Triangulation对象的蒙版并将对象直接传递给plot_trisurf。 12345678910111213141516171819202122232425262728293031323334353637383940414243444546474849505152535455565758596061626364656667686970import numpy as npimport matplotlib.pyplot as pltimport matplotlib.tri as mtri# This import registers the 3D projection, but is otherwise unused.from mpl_toolkits.mplot3d import Axes3D # noqa: F401 unused importfig = plt.figure(figsize=plt.figaspect(0.5))#=========...

2021-03-09
基础篇——4.SQL
1 数据库基本对象DDL(数据库定义语言) sql 不提供修改模式定义和修改视图定义的操作。如果想要更改,智能删除重建。数据库中操作的基本对象主要有以下内容:模式、表、视图、索引 1.1 基本对象概述 主要包括增删改。没有针对基本对象的查询。就像你会查询表中的数据,但是不会查询存在的某一张表。查询表不存在,应该是查询表中的数据。 操作对象 创建 删除 修改 模式SCHEMA CREATE SCHEMA DROP SCHEMA 表TABLE CREATE TABLE DROP TABLE ALTER TABLE 视图VIEW CREATE VIEW DROP VIEW 索引INDEX CREATE INDEX DROP INDEX ALTER INDEX 字段COLUMN ADD COLUMN DROP COLUMN ALTER COLUMN 12345graph LR模式Schema-->表Table模式Schema-->视图View表Table-->索引Index表Table-->字段Colume 基本对象的...

2021-03-06
13.动态内存管理实现
动态内存1 C中动态内存的实现概念 c 语言主要是使用malloc / calloc / realloc 来进行内存申请的。 共同点 都是从堆上进行动态内存分配 释放内存都是需要使用free函数来释放 三者的返回值都是void* 都需要强制类型转换 都需要对申请出的空间判空(因为申请内存失败会返回空) malloc1void *malloc( size_t size ); malloc的参数是用户所需内存空间大小的字节数,不会对申请成功的内存初始化。 malloc 申请空间时并不是需要多少就申请多少,而是会多申请一些空间, 多申请一个32字节的结构体,里面对申请的空间进行描述, 在申请的空间前后会各多申请 4 个字节的空间,这就是保护机制,当你操作不当越界了,这 8 个字节的内容会改变,操作系统会检查前后 4 个字节是否改变了,以此判断是否越界了。 calloc1void *calloc( size_t num, size_t size ); calloc的参数:第一个:元素的个数,第二个:单个元素所占字节;会把申请成功的空间初始化为 0 re...

2022-04-18
baidu-map
如何使用HTML 页面 引入百度地图提供的JS文件 1<script src="http://api.map.baidu.com/api?v=2.0&ak=HbUVYMUg6PwbOnXkztdgSQlQ"></script> 定义容器元素<div></div> 1234567891011121314151617181920212223242526272829<!doctype html><html lang="en"> <head> <meta charset="UTF-8"> <title>百度地图如何使用</title> <style type="text/css"> body, html,#allmap { width: 100%; height: 100%; overflow: hidden; margin:0; fon...


