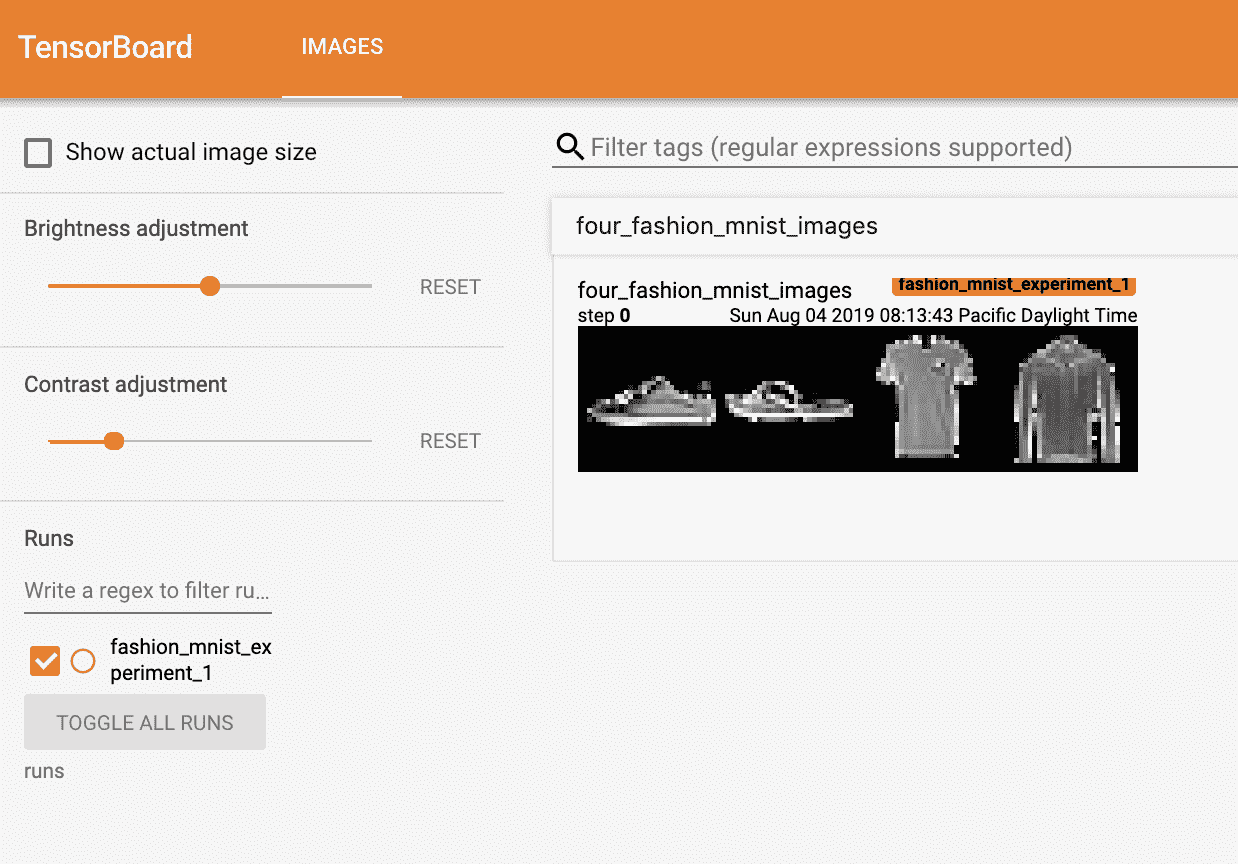
# helper function to show an image # (used in the `plot_classes_preds` function below) defmatplotlib_imshow(img, one_channel=False): if one_channel: img = img.mean(dim=0) img = img / 2 + 0.5# unnormalize npimg = img.numpy() if one_channel: plt.imshow(npimg, cmap="Greys") else: plt.imshow(np.transpose(npimg, (1, 2, 0)))
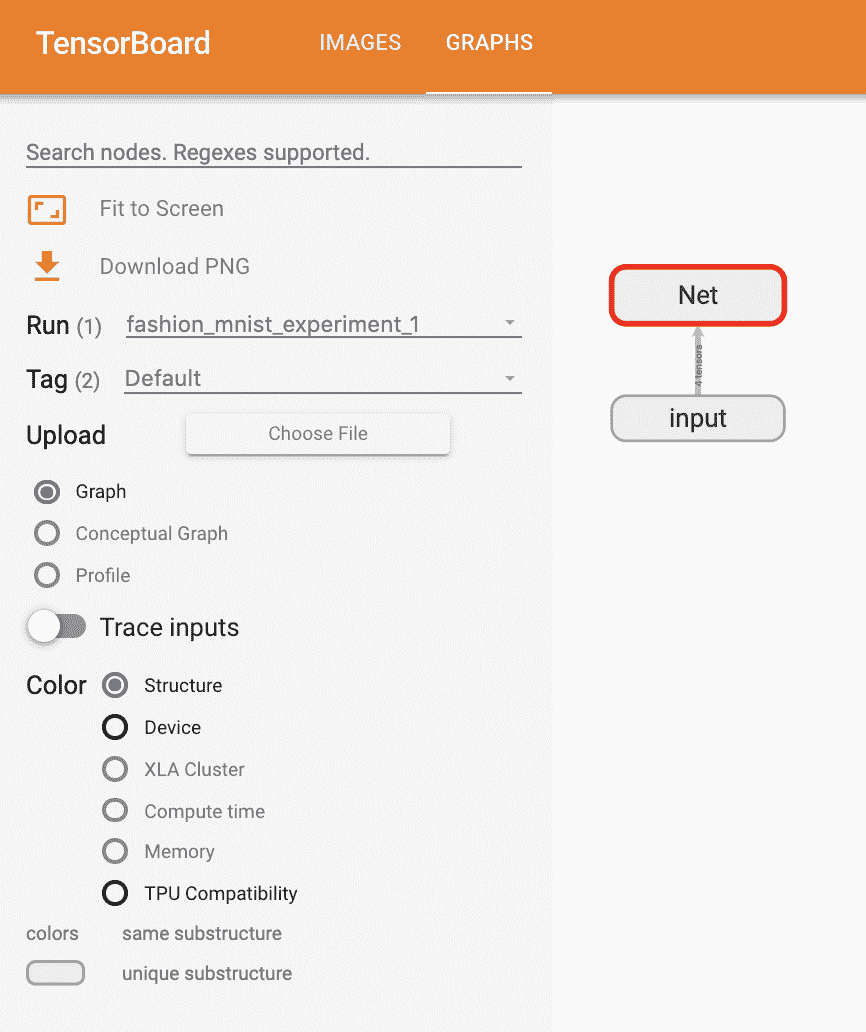
defforward(self, x): x = self.pool(F.relu(self.conv1(x))) x = self.pool(F.relu(self.conv2(x))) x = x.view(-1, 16 * 4 * 4) x = F.relu(self.fc1(x)) x = F.relu(self.fc2(x)) x = self.fc3(x) return x
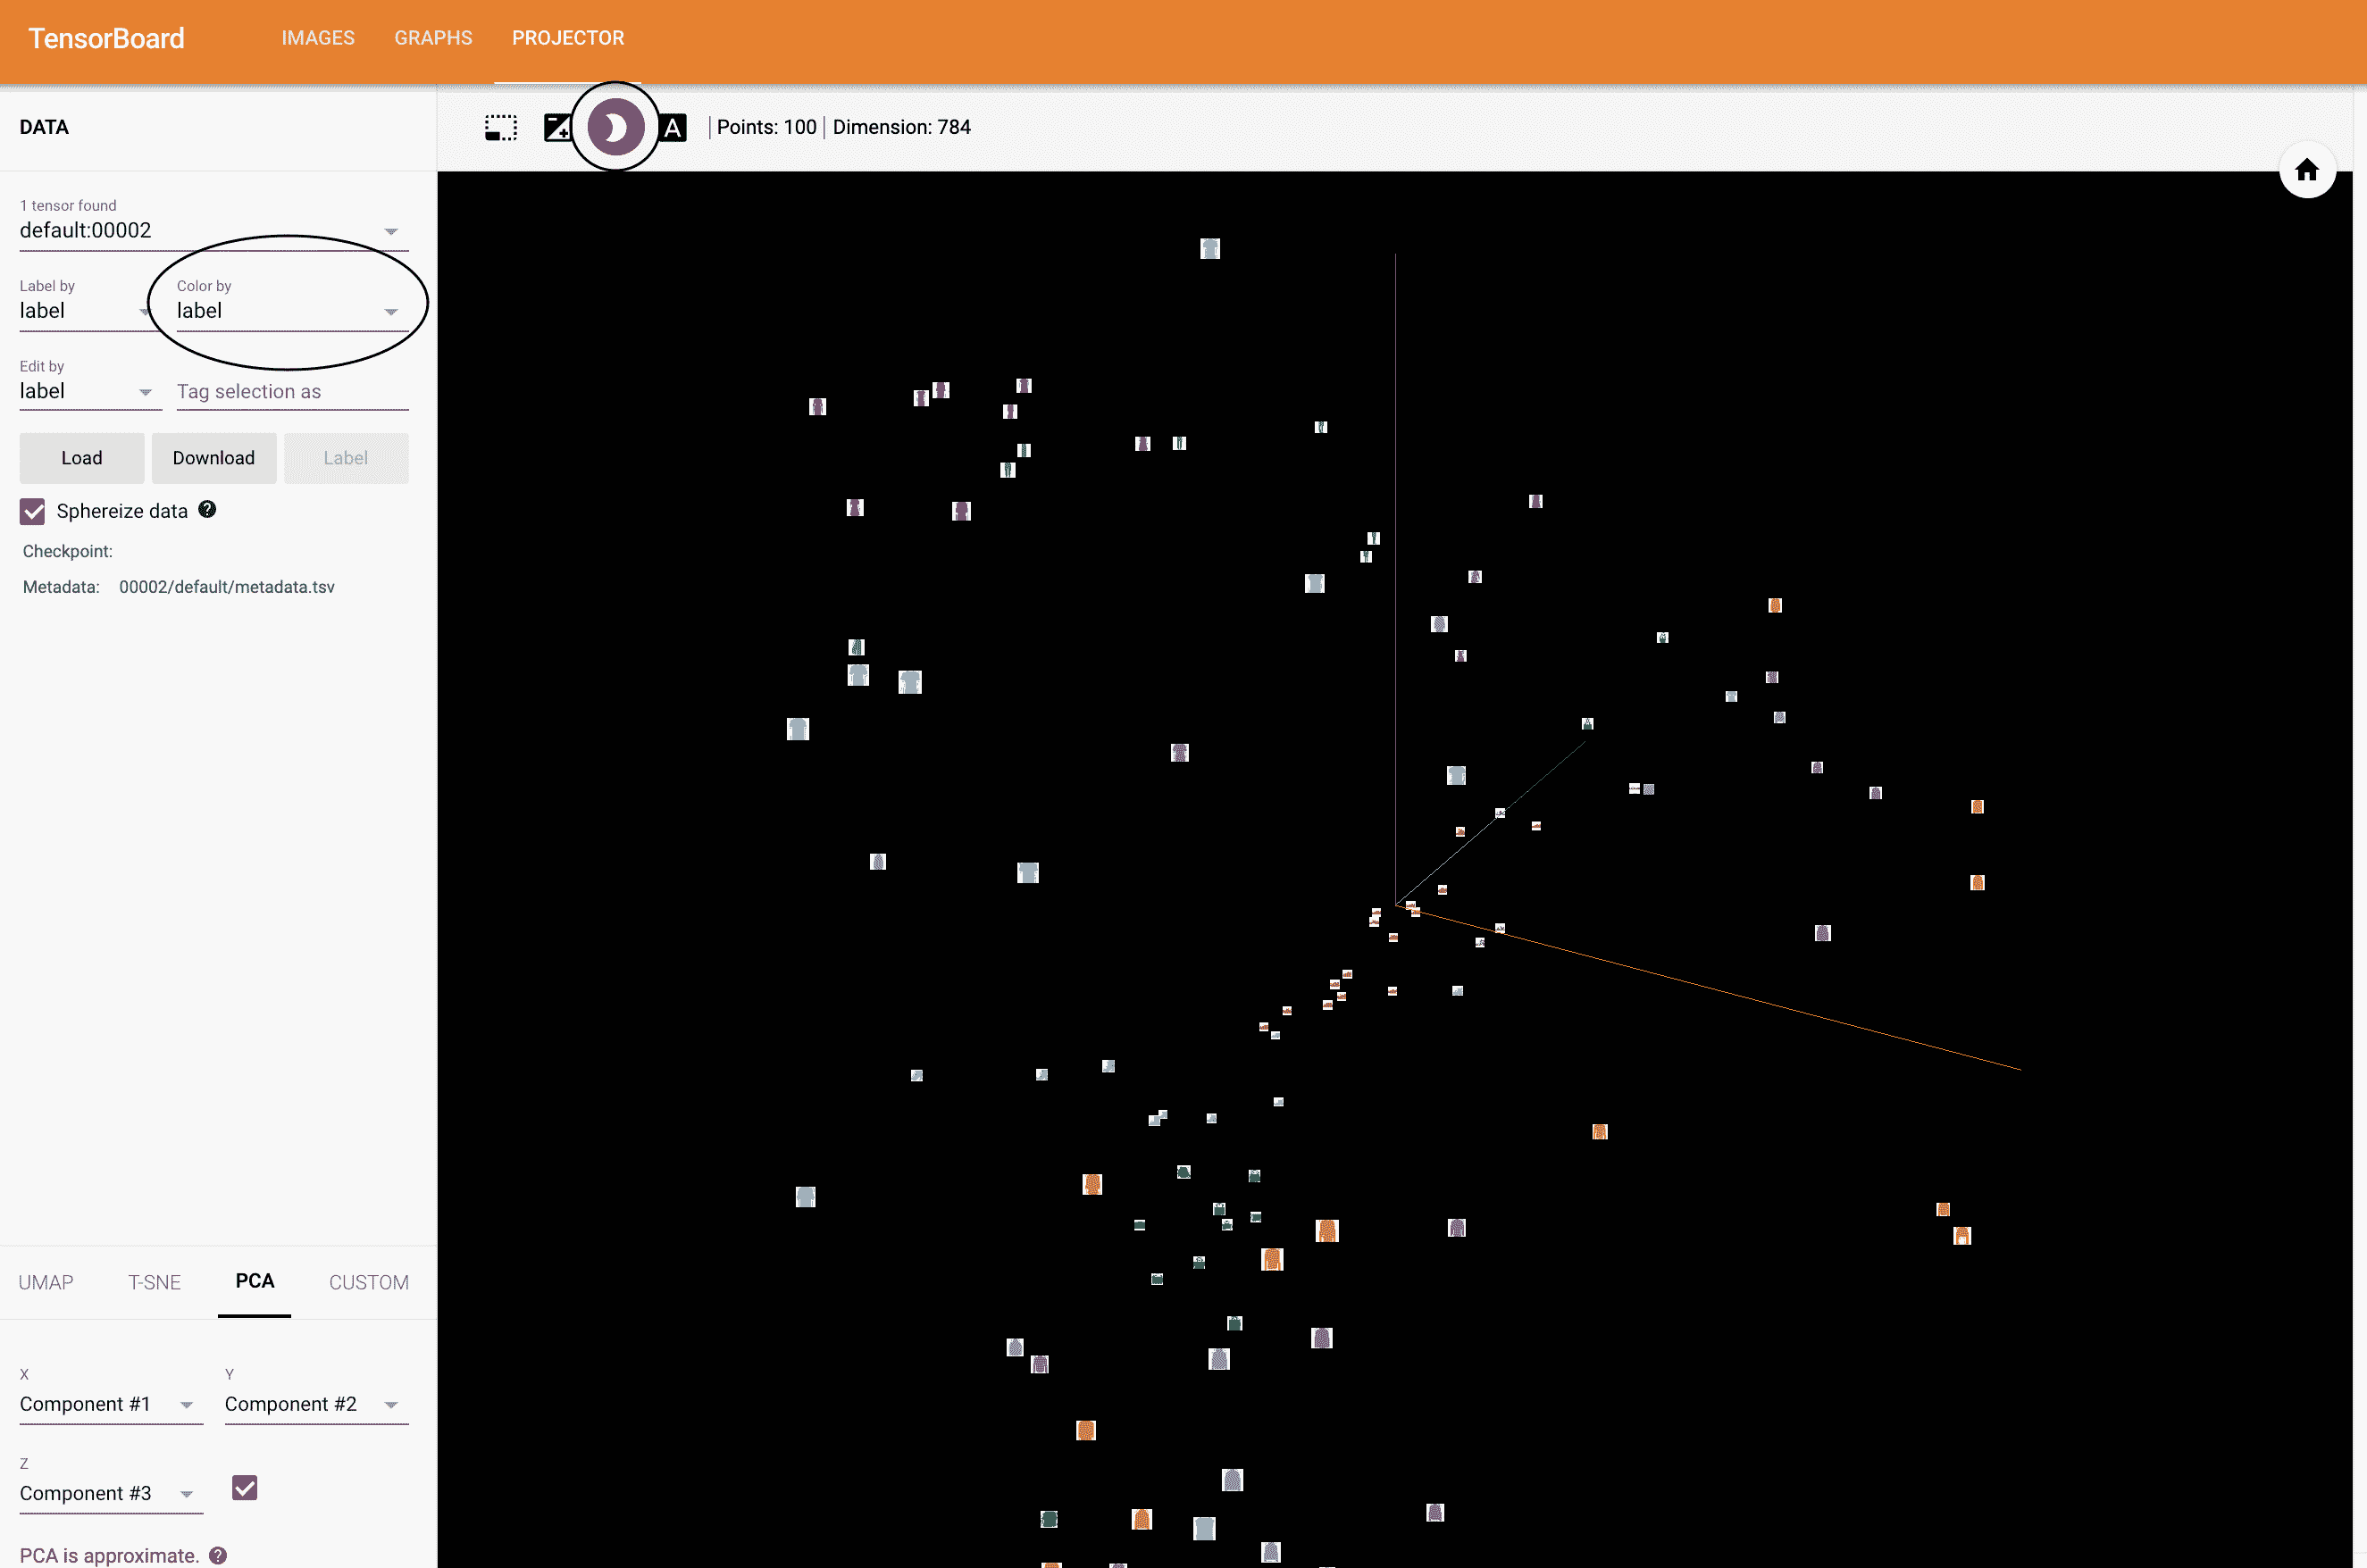
# helper function defselect_n_random(data, labels, n=100): ''' Selects n random datapoints and their corresponding labels from a dataset ''' assertlen(data) == len(labels)
defimages_to_probs(net, images): ''' Generates predictions and corresponding probabilities from a trained network and a list of images ''' output = net(images) # convert output probabilities to predicted class _, preds_tensor = torch.max(output, 1) preds = np.squeeze(preds_tensor.numpy()) return preds, [F.softmax(el, dim=0)[i].item() for i, el inzip(preds, output)]
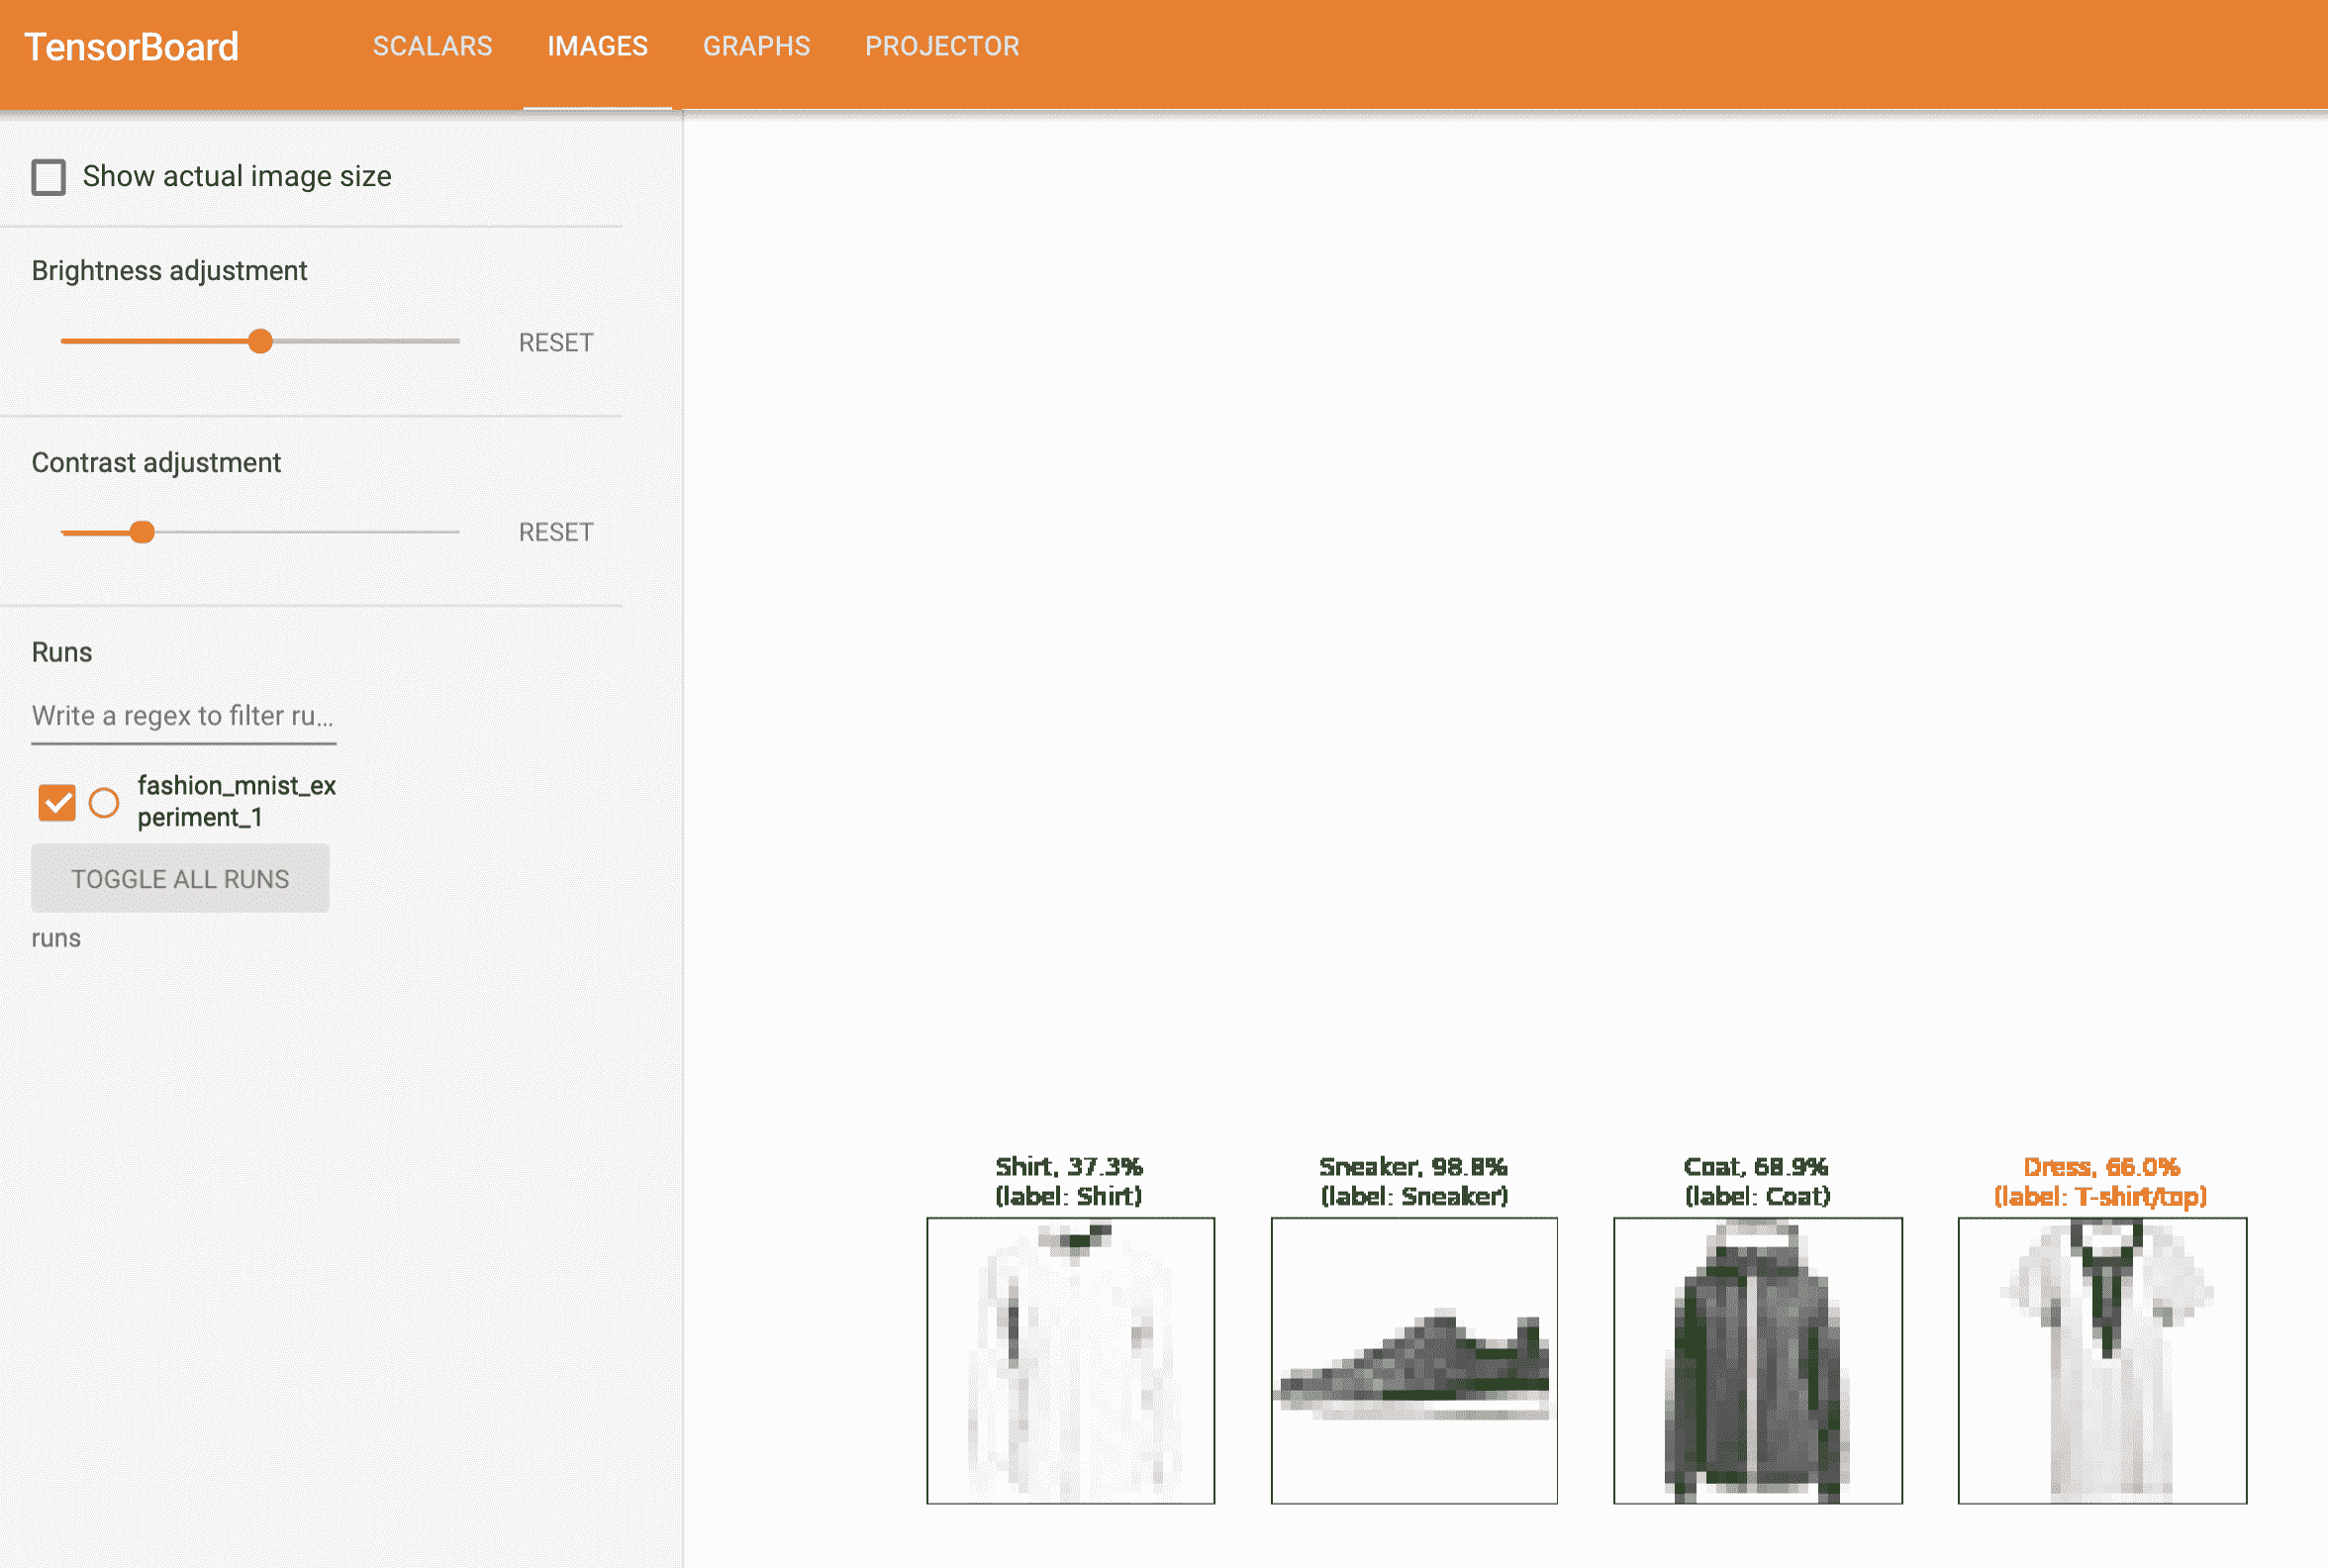
defplot_classes_preds(net, images, labels): ''' Generates matplotlib Figure using a trained network, along with images and labels from a batch, that shows the network's top prediction along with its probability, alongside the actual label, coloring this information based on whether the prediction was correct or not. Uses the "images_to_probs" function. ''' preds, probs = images_to_probs(net, images) # plot the images in the batch, along with predicted and true labels fig = plt.figure(figsize=(12, 48)) for idx in np.arange(4): ax = fig.add_subplot(1, 4, idx+1, xticks=[], yticks=[]) matplotlib_imshow(images[idx], one_channel=True) ax.set_title("{0}, {1:.1f}%\n(label: {2})".format( classes[preds[idx]], probs[idx] * 100.0, classes[labels[idx]]), color=("green"if preds[idx]==labels[idx].item() else"red")) return fig
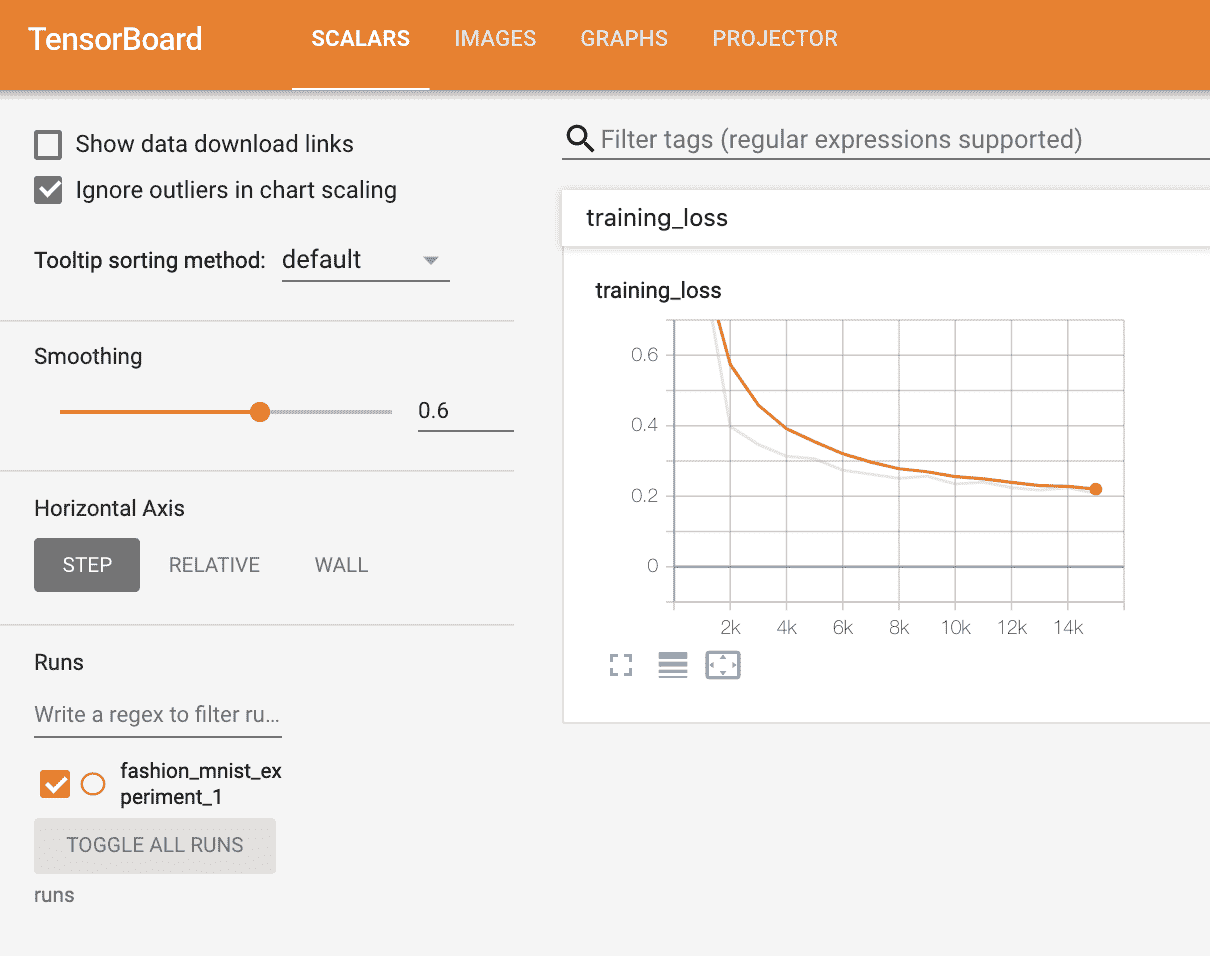
running_loss += loss.item() if i % 1000 == 999: # every 1000 mini-batches...
# ...log the running loss writer.add_scalar('training loss', running_loss / 1000, epoch * len(trainloader) + i)
# ...log a Matplotlib Figure showing the model's predictions on a # random mini-batch writer.add_figure('predictions vs. actuals', plot_classes_preds(net, inputs, labels), global_step=epoch * len(trainloader) + i) running_loss = 0.0 print('Finished Training')
# 1\. gets the probability predictions in a test_size x num_classes Tensor # 2\. gets the preds in a test_size Tensor # takes ~10 seconds to run class_probs = [] class_preds = [] with torch.no_grad(): for data in testloader: images, labels = data output = net(images) class_probs_batch = [F.softmax(el, dim=0) for el in output] _, class_preds_batch = torch.max(output, 1)
test_probs = torch.cat([torch.stack(batch) for batch in class_probs]) test_preds = torch.cat(class_preds)
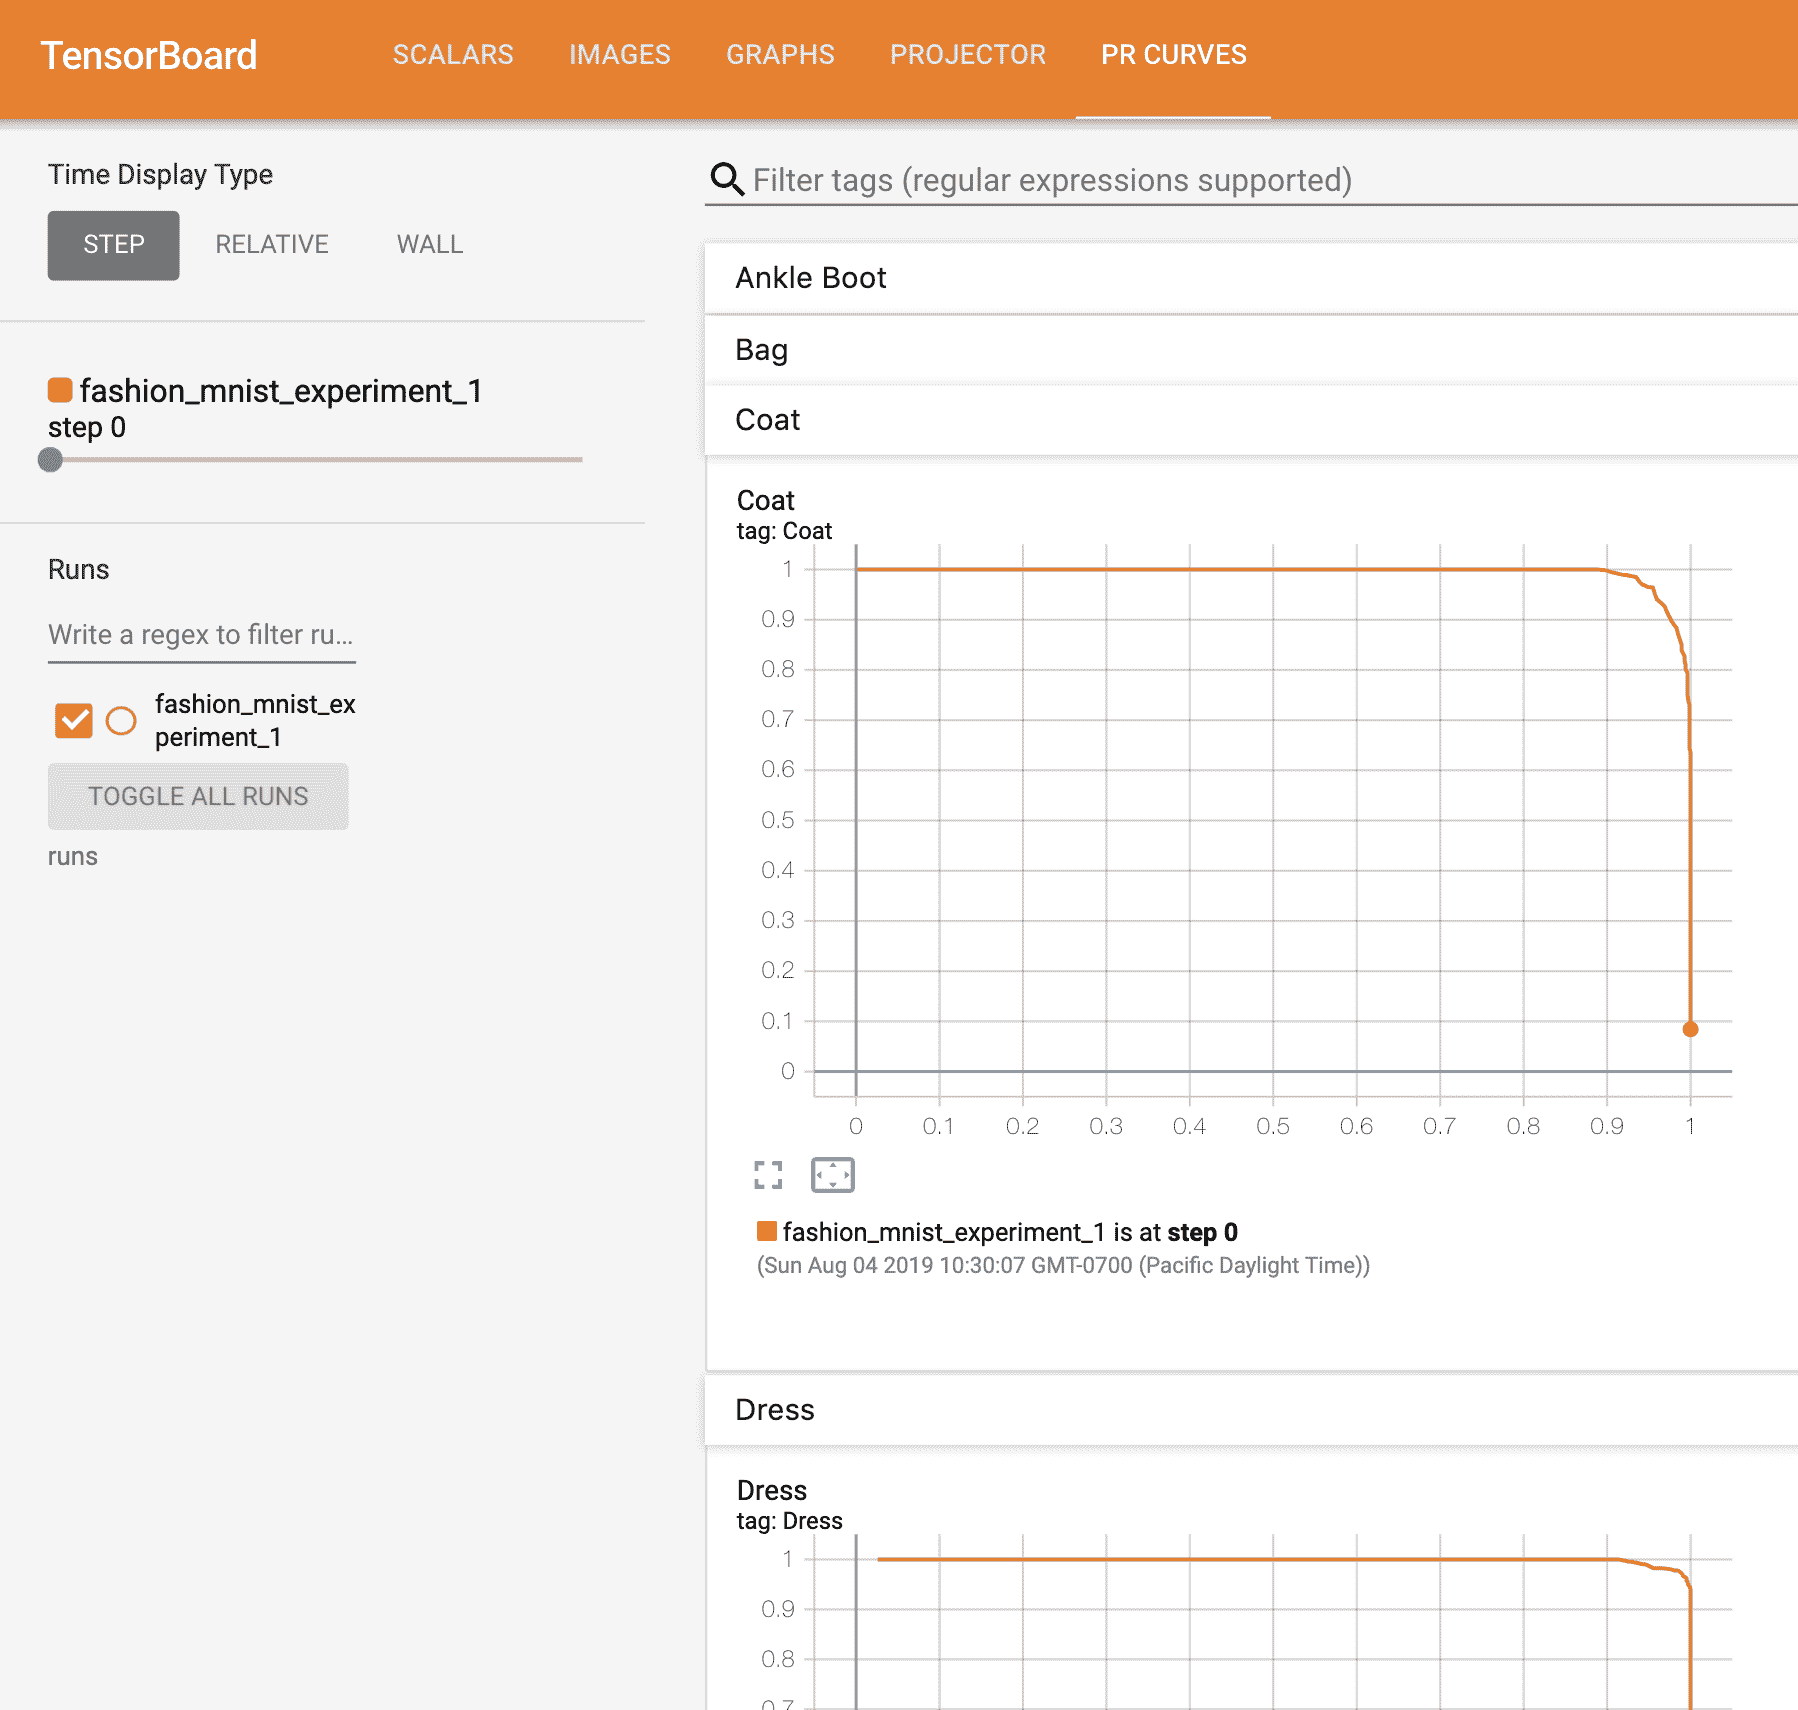
# helper function defadd_pr_curve_tensorboard(class_index, test_probs, test_preds, global_step=0): ''' Takes in a "class_index" from 0 to 9 and plots the corresponding precision-recall curve ''' tensorboard_preds = test_preds == class_index tensorboard_probs = test_probs[:, class_index]