
02 快速开始
快速开始
1 Prometheus
- 从https://prometheus.io/download/找到最新版本的Prometheus Sevrer软件包:
1 | export VERSION=2.4.3 |
Promtheus作为一个时间序列数据库,其采集的数据会以文件的形式存储在本地中,默认的存储路径为data/ .用户也可以通过参数–storage.tsdb.path=”data/“修改本地数据存储的路径。启动命令如下
1 | ./prometheus |
- mac brew 安装
1 | 9828 brew install prometheus |
- docker 安装
1 | docker run -p 9090:9090 -v /etc/prometheus/prometheus.yml:/etc/prometheus/prometheus.yml prom/prometheus |
2 配置文件
1 | # my global config |
3 NodeExporter
- 安装。可以从https://prometheus.io/download/获取最新的node exporter版本的二进制包。
1 | curl -OL https://github.com/prometheus/node_exporter/releases/download/v0.15.2/node_exporter-0.15.2.darwin-amd64.tar.gz |
1 | node_boot_time:系统启动时间 |
- 修改配置文件,并重启prometheus
1 | scrape_configs: |
4 PromQL
Prometheus UI是Prometheus内置的一个可视化管理界面,通过Prometheus UI用户能够轻松的了解Prometheus当前的配置,监控任务运行状态等。 通过Graph面板,用户还能直接使用PromQL实时查询监控数据:
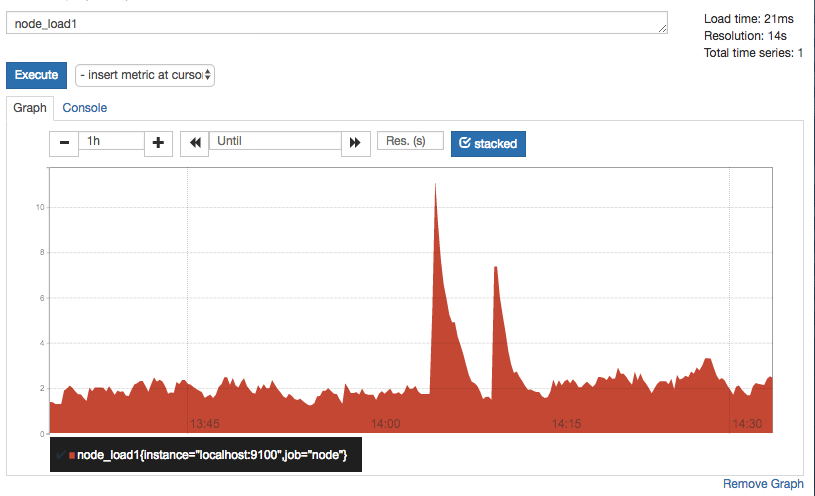
切换到Graph面板,用户可以使用PromQL表达式查询特定监控指标的监控数据。如下所示,查询主机负载变化情况,可以使用关键字node_load1可以查询出Prometheus采集到的主机负载的样本数据,这些样本数据按照时间先后顺序展示,形成了主机负载随时间变化的趋势图表:
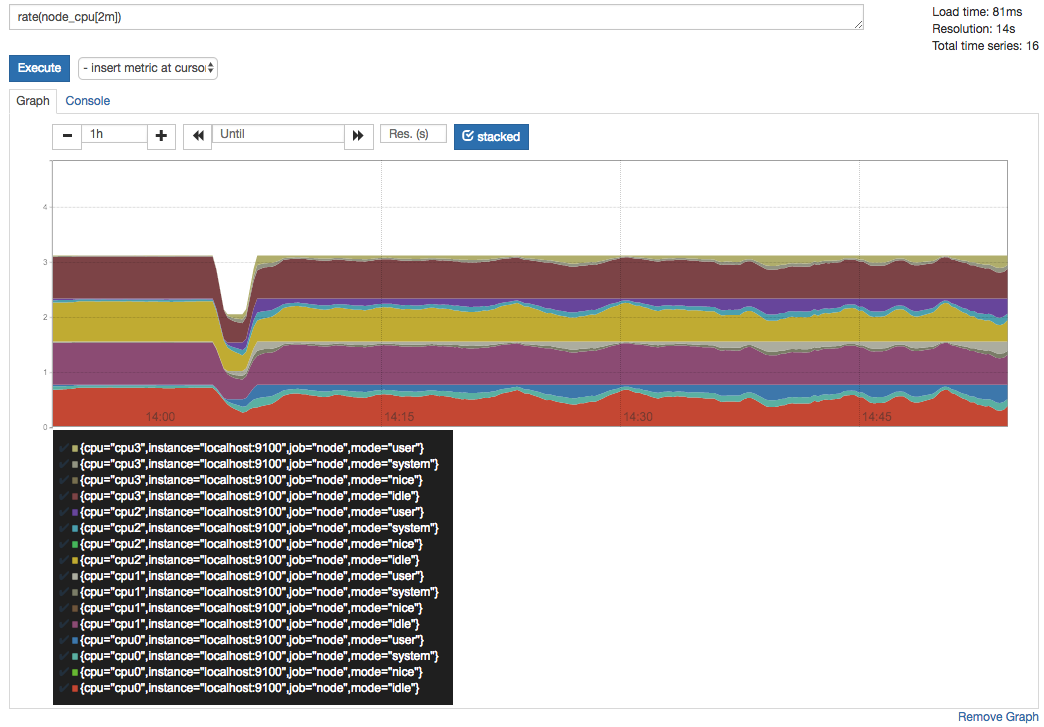
PromQL是Prometheus自定义的一套强大的数据查询语言,除了使用监控指标作为查询关键字以为,还内置了大量的函数,帮助用户进一步对时序数据进行处理。例如使用rate()函数,可以计算在单位时间内样本数据的变化情况即增长率,因此通过该函数我们可以近似的通过CPU使用时间计算CPU的利用率:
rate(node_cpu[2m])
5 Grafana
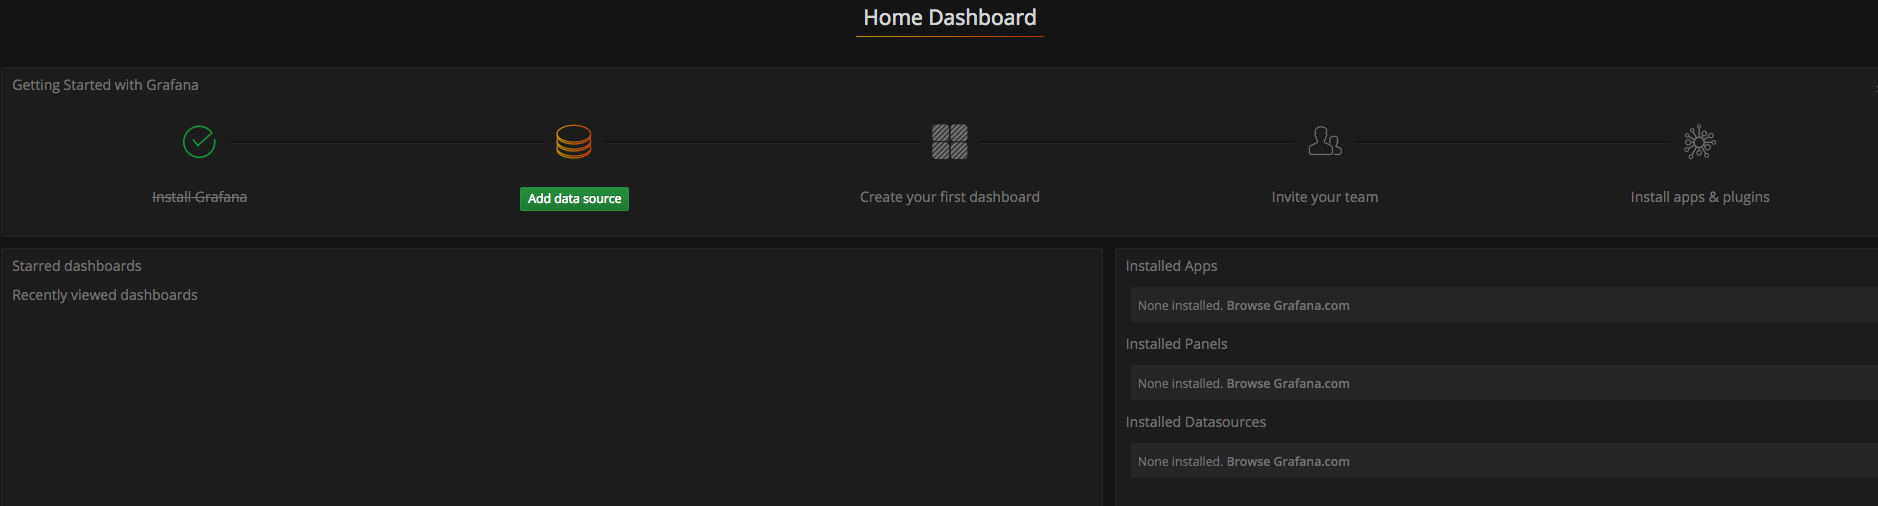
- 安装启动grafana.访问http://localhost:3000就可以进入到Grafana的界面中,默认情况下使用账户admin/admin进行登录。在Grafana首页中显示默认的使用向导,包括:安装、添加数据源、创建Dashboard、邀请成员、以及安装应用和插件等主要流程.
1 | docker run -d -p 3000:3000 grafana/grafana |
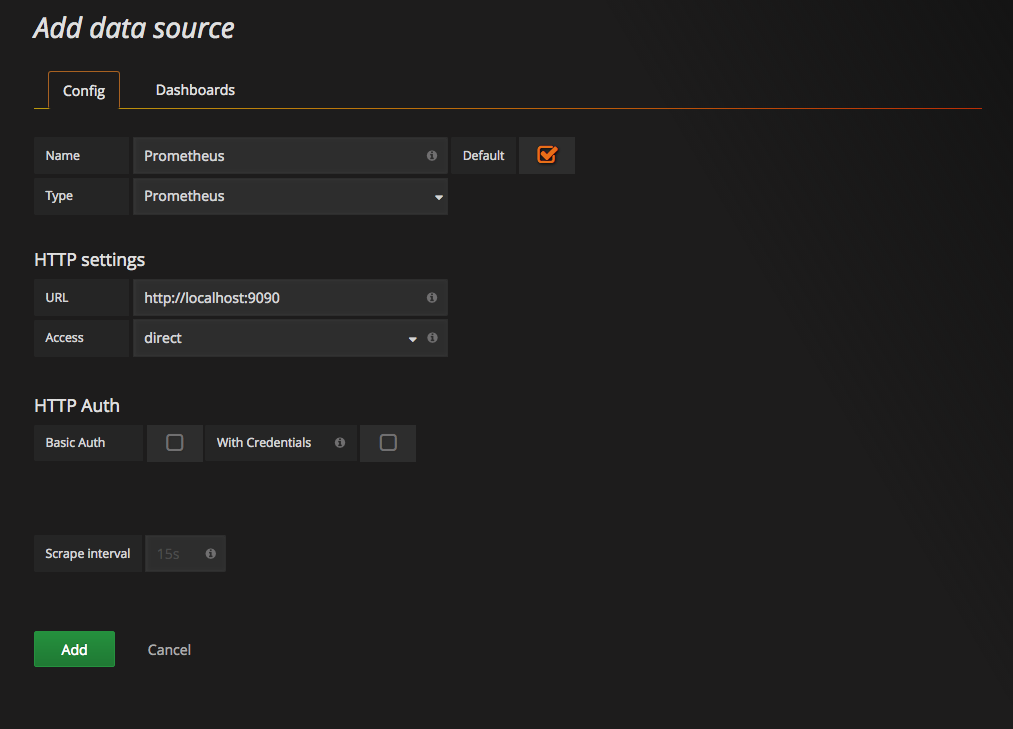
- 这里将添加Prometheus作为默认的数据源
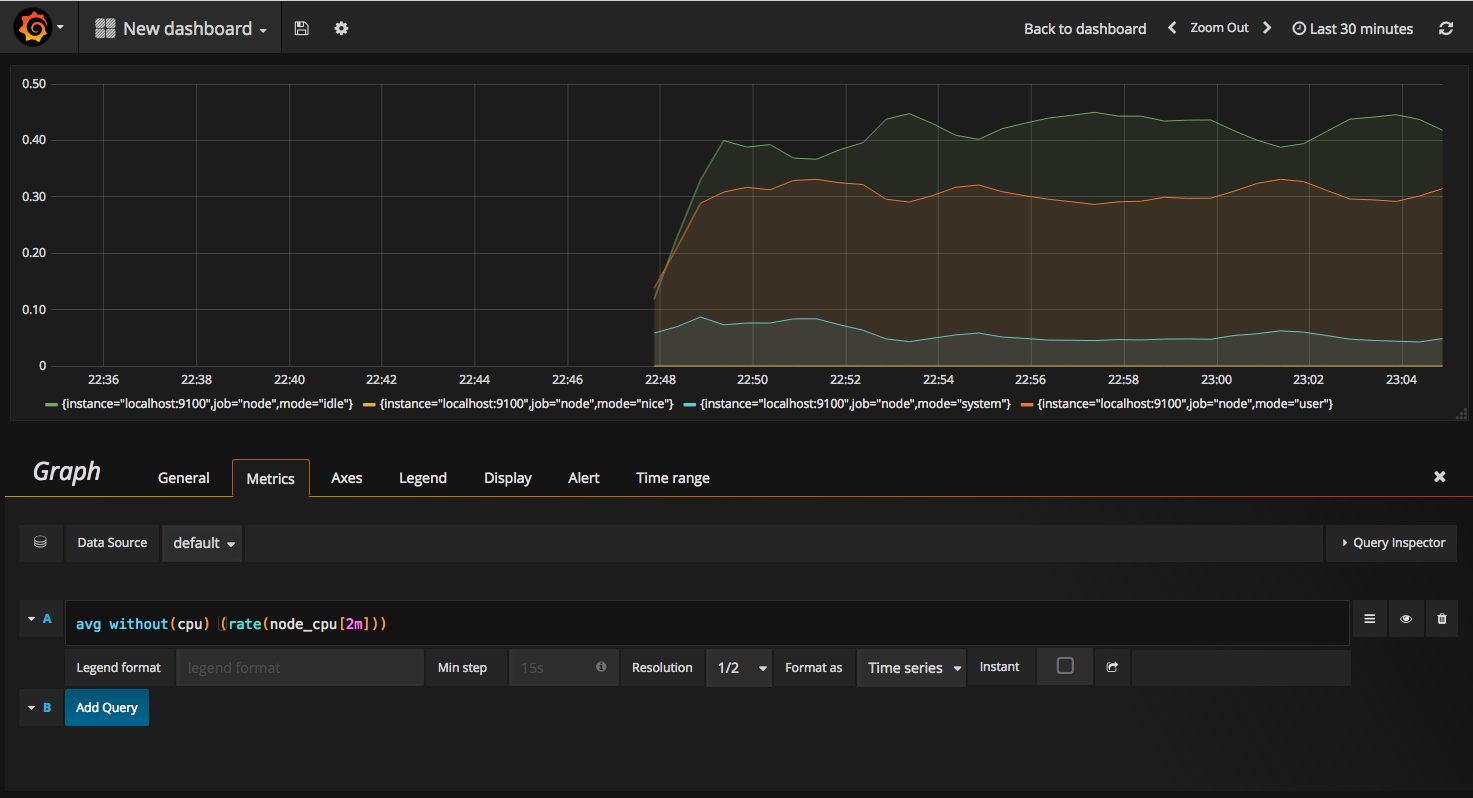
- 在完成数据源的添加之后就可以在Grafana中创建我们可视化Dashboard了。Grafana提供了对PromQL的完整支持,如下所示,通过Grafana添加Dashboard并且为该Dashboard添加一个类型为“Graph”的面板。 并在该面板的“Metrics”选项下通过PromQL查询需要可视化的数据
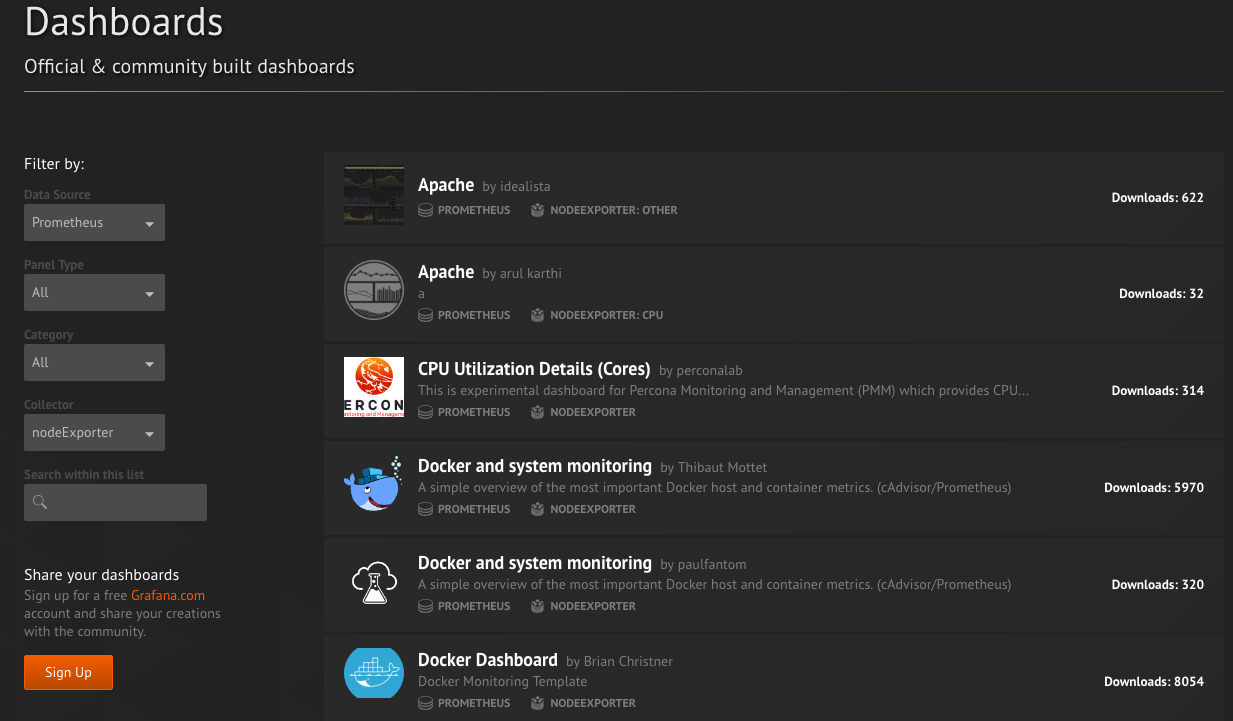
- 当然作为开源软件,Grafana社区鼓励用户分享Dashboard通过https://grafana.com/dashboards网站,可以找到大量可直接使用的Dashboard.Grafana中所有的Dashboard通过JSON进行共享,下载并且导入这些JSON文件,就可以直接使用这些已经定义好的Dashboard
本博客所有文章除特别声明外,均采用 CC BY-NC-SA 4.0 许可协议。转载请注明来源 Estom的博客!
相关推荐

2020-09-26
ellipse_demo
椭圆演示绘制多个椭圆。此处绘制单个椭圆。将其与Ellipse集合示例进行比较。 12345678910111213141516171819202122import matplotlib.pyplot as pltimport numpy as npfrom matplotlib.patches import EllipseNUM = 250ells = [Ellipse(xy=np.random.rand(2) * 10, width=np.random.rand(), height=np.random.rand(), angle=np.random.rand() * 360) for i in range(NUM)]fig, ax = plt.subplots(subplot_kw={'aspect': 'equal'})for e in ells: ax.add_artist(e) e.set_clip_box(ax.bbox) ...

2021-09-02
20-单元测试
原文:Go语言基础之单元测试 和 视频 122-124 不写测试的开发不是好程序员。我个人非常崇尚 TDD(Test Driven Development)的,然而可惜的是国内的程序员都不太关注测试这一部分。 这篇文章主要介绍下在 Go 语言中如何做单元测试和基准测试。 20.1 go test 工具Go 语言中的测试依赖 go test 命令。编写测试代码和编写普通的 Go 代码过程是类似的,并不需要学习新的语法、规则或工具。 go test 命令是一个按照一定约定和组织的测试代码的驱动程序。在包目录内,所有以**_test.go**为后缀名的源代码文件都是 go test 测试的一部分,不会被 go build 编译到最终的可执行文件中。 在 *_test.go 文件中有三种类型的函数:单元测试函数、基准测试函数和示例函数。 类型 格式 作用 测试函数 函数名前缀为 Test ,测试程序的一些逻辑行为是否正确 基准函数 函数名前缀为 Benchmark,测试函数的性能 示例函数 函数名前缀为 Example,为文档提供示例文档 go test ...

2020-09-26
pie_features
基本饼图演示一个基本的饼图和一些额外的功能。 除了基本饼图外,此演示还显示了以下几个可选功能: 切片标签。 自动标记百分比。 用 explode 偏移切片。 投影。 自定义起始角度 请注意,自定义起点角度: 默认的起始角度(startangle)为0,这将在正x轴上开始“Frogs”切片。此示例将 startangle设置为90 ,以便将所有对象逆时针旋转90度,并且青蛙切片从正y轴开始。 12345678910111213import matplotlib.pyplot as plt# Pie chart, where the slices will be ordered and plotted counter-clockwise:labels = 'Frogs', 'Hogs', 'Dogs', 'Logs'sizes = [15, 30, 45, 10]explode = (0, 0.1, 0, 0) # only "explode" the 2nd slice (i....
2024-01-30
02 模板语法GoTemplate
## **Go语言的模板引擎** Go语言内置了文本模板引擎text/template和用于HTML文档的html/templant. 它们的作用机制可以简单归纳如下: 1. 模板文件通常定义为.tmpl和.tpl为后缀(也可以使用其他后缀), 必须使用utf-8编码. 2. 模板文件中使用{{和}}包裹和标识需要传入的数据. 3. 传给模板这样的数据就可以通过点号(.)来访问,如果数据是复杂类型的数据, 可以通过{{.FieldName}}来访问它的字段. 4. 除{{和}}包裹的内容外, 其他内容均不做修改原样输出. --- ## 模板引擎的使用 Go语言模板引擎的使用可以分文三部分: 定义模板文件/解析模板文件/渲染模板文件 > 定义模板文件 其中, 定义模板文件时需要我们按照相关语法规则去编写, 后文会详细介绍. > 解析模板文件 上面定义好了模板文件之后,可以使用下面的常用方法去解析模板文件, 得到模板对象: 123func (t...

2020-09-26
pie_demo2
Pie 绘制饼图演示使用 pie(). 制作饼图。 此示例演示了一些饼图功能,如标签、可变大小、自动标记百分比、偏移切片和添加阴影。 1234567891011121314151617181920212223242526272829303132333435import matplotlib.pyplot as plt# Some datalabels = 'Frogs', 'Hogs', 'Dogs', 'Logs'fracs = [15, 30, 45, 10]# Make figure and axesfig, axs = plt.subplots(2, 2)# A standard pie plotaxs[0, 0].pie(fracs, labels=labels, autopct='%1.1f%%', shadow=True)# Shift the second slice using explodeaxs[0, 1].pie(fracs, labels=labels, ...

2020-09-26
sankey_links
使用Sankey的长链连接通过建立长链连接来演示/测试Sankey类。 123456789101112131415161718192021222324252627282930313233343536373839404142434445464748import matplotlib.pyplot as pltfrom matplotlib.sankey import Sankeylinks_per_side = 6def side(sankey, n=1): """Generate a side chain.""" prior = len(sankey.diagrams) for i in range(0, 2*n, 2): sankey.add(flows=[1, -1], orientations=[-1, -1], patchlabel=str(prior + i), prior=prior + i - ...


